At EarningsBeats.com, we provide market guidance and analysis of the major indices, sectors, industry groups, and individual stocks. Our research provides our members with various ChartLists to organize strong trading candidates by categories such as Strong Earnings, Strong AD, Short Squeeze, etc. Over the years, I've never really spent much time dissecting ETFs, other than those that track our primary indices and sectors, and occasionally industry groups.
I do realize that many of you would rather trade ETFs, however. But where do you start? There are so many and while past performance is clearly one criteria you should use in selecting the right ETF for you, I wouldn't overlook the individual stock components. While you might believe you're diversifying your investments by owning ETFs, many ETFs are heavily concentrated in just a few names. For instance, the popular consumer discretionary ETF (XLY) is represented heavily by Amazon.com (23%) and Home Depot (12%). If you own other ETFs, it's quite possible that they own these two companies. So unless you review your ETF's top holdings and sector representation, you truly won't know how much of each stock you truly own and the amount of risk you're taking. Personally, I'm not a fan of diversification because I'm a momentum trader and not all stocks have solid bullish momentum. For many, though, I understand that diversifying and holding both strong and weak stocks helps to balance out your risk. It makes you feel more comfortable investing in overlooked sectors and industries. I get that, but still believe that investing in these areas after they begin to show relative strength makes more sense.
If I were to begin to build a portfolio of solid ETFs, I'd start by doing the following:
Evaluate Past Performance
Use the powerful StockCharts.com scan engine to get this process started. Here's a simple scan I ran to begin to vet potential ETF candidates:
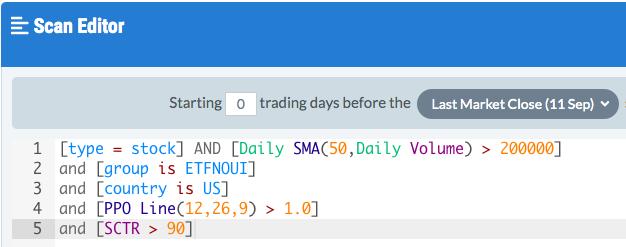
You certainly can adjust these parameters to fit your own style and strategy, but from a momentum perspective, I find the above criteria will quickly point out the "stars" that I might further vet. A couple keys of the above scan is that (1) I want to eliminate the "ultra" and "inverse" ETFs. That's what "[group is ETFNOUI]" does. (2) I also want to make sure there's solid momentum. If an ETF has a PPO line above 1 and a SCTR score above 90, it should have considerable momentum.
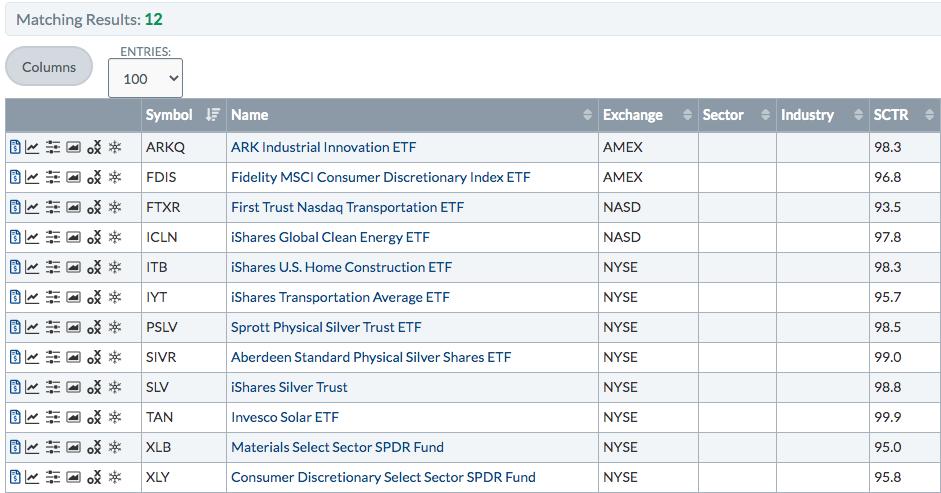
Here were the results to the above scan:
Then it's on to the next step:
Review Long-Term Absolute And Relative Strength
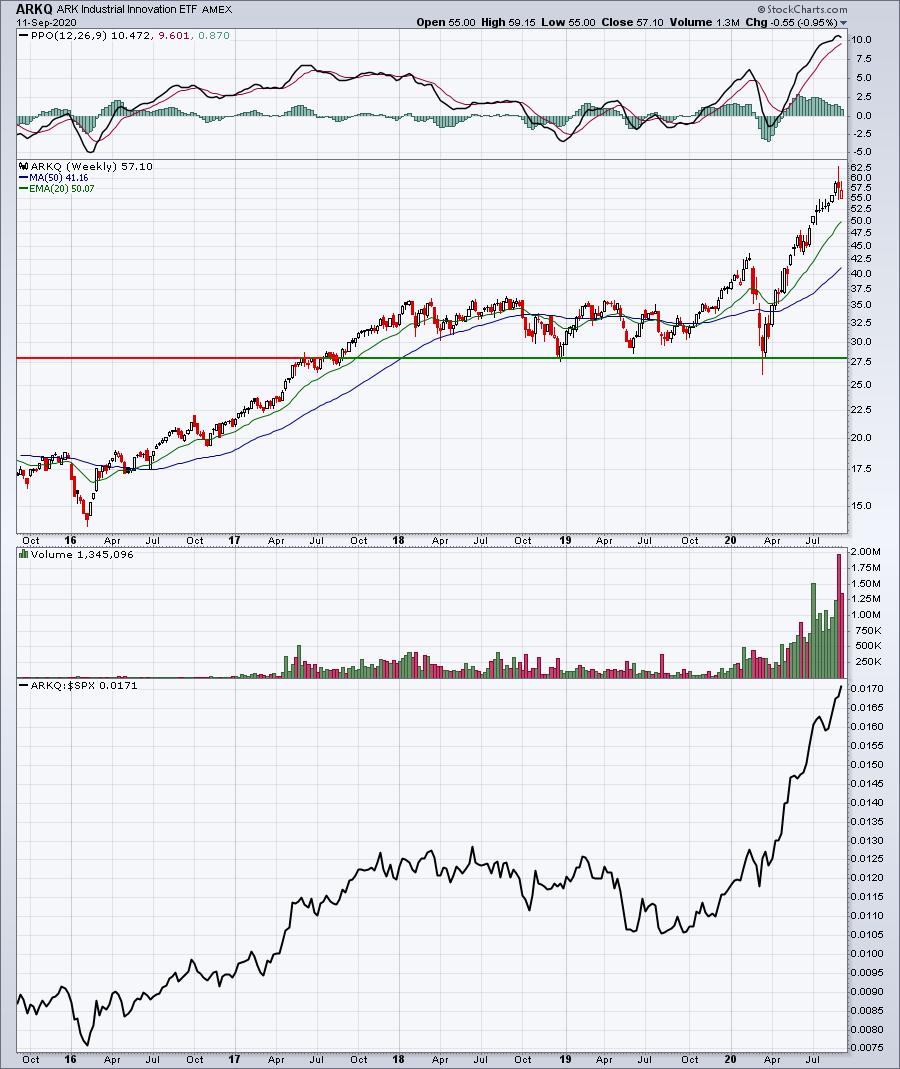
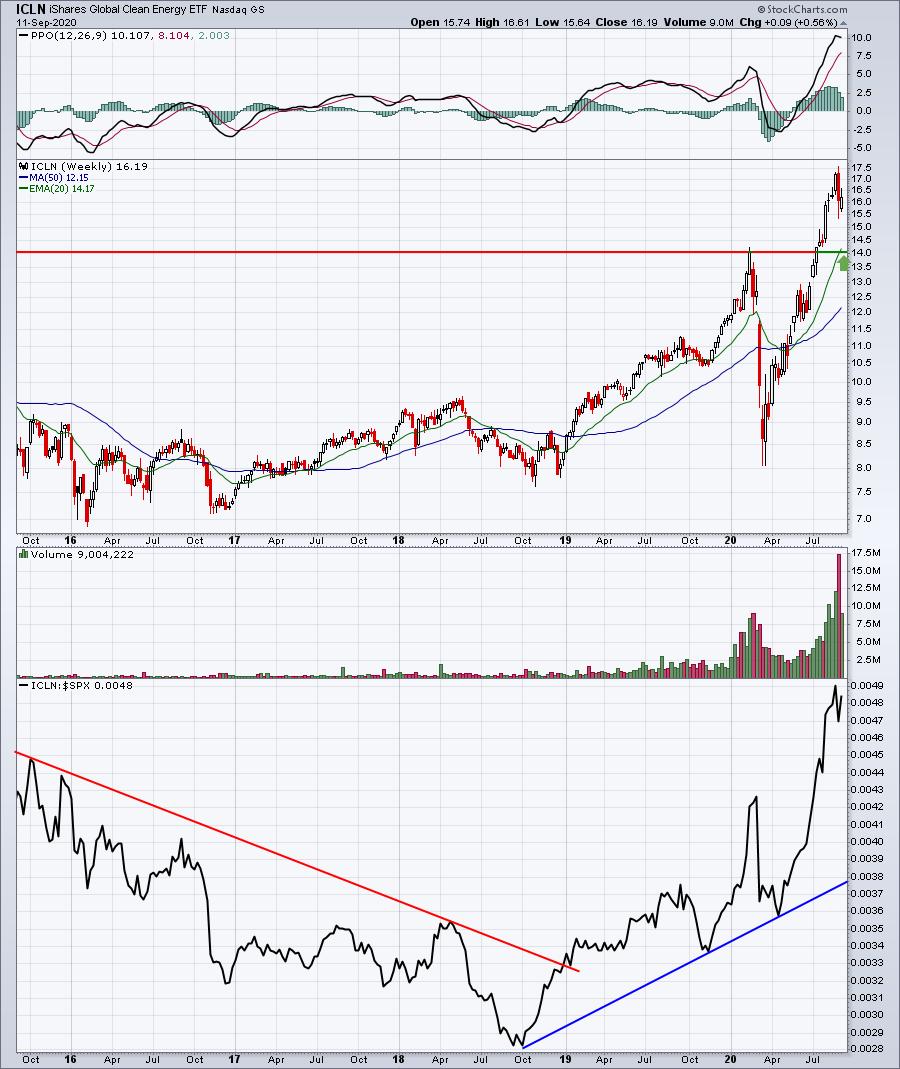
For this step, let me provide you two examples from the scan results above:
ARKQ:
ICLN:
PSLV:
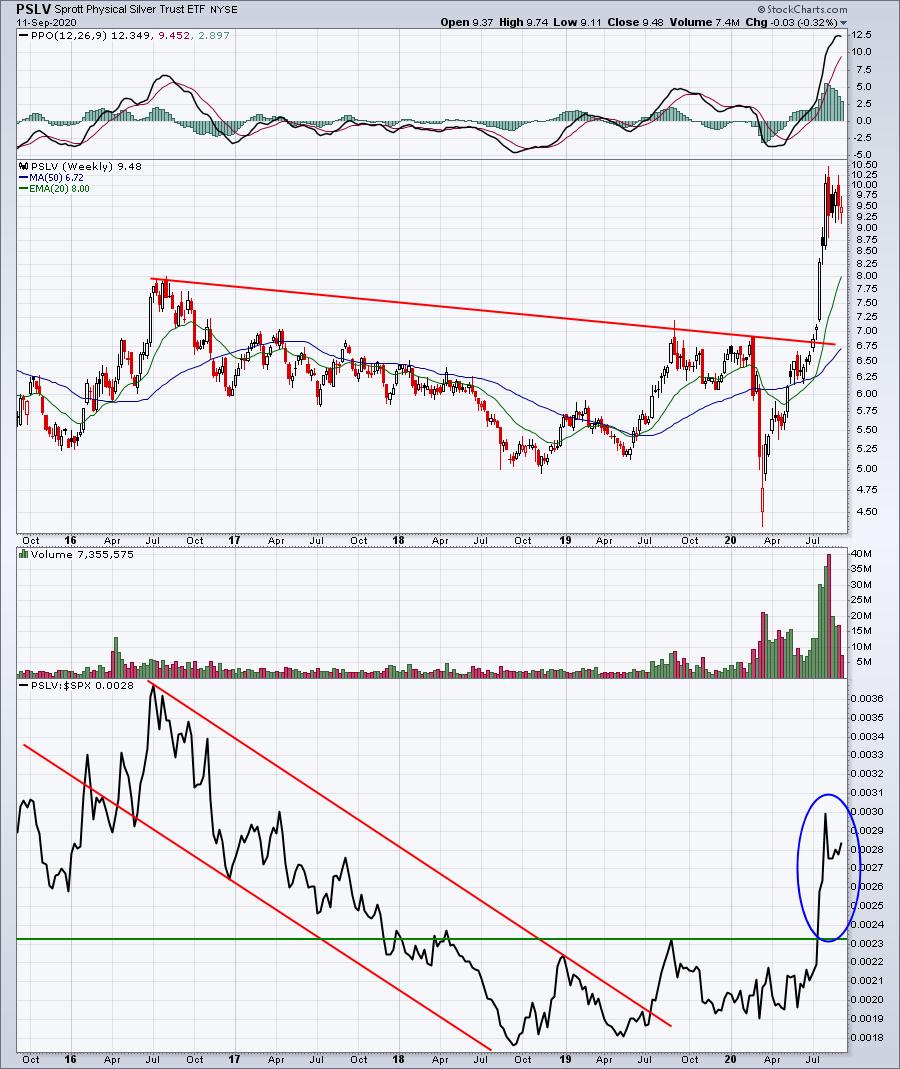
These are 3 VERY different looking long-term charts. ARKQ appears to be a much more reliable bull market performer, showing mostly relative strength over the past 5 years. ICLN seemed to be mostly ignored on a relative basis until 2019, when it broke out vs. the S&P 500. It's currently in a solid uptrend vs. that benchmark. Finally, PSLV has suddenly caught fire (due, at least in part, to a weakening dollar), but clearly is not nearly as reliable as either of the other two. PSLV would not represent much of my ETF portfolio, despite its recent strength, based on its long-term track record.
Let's break down ARKQ a bit further:
Looking At Sector Representation And Holdings
To further vet ARKQ, which sectors does it invest in? Well, this is from Yahoo Finance:
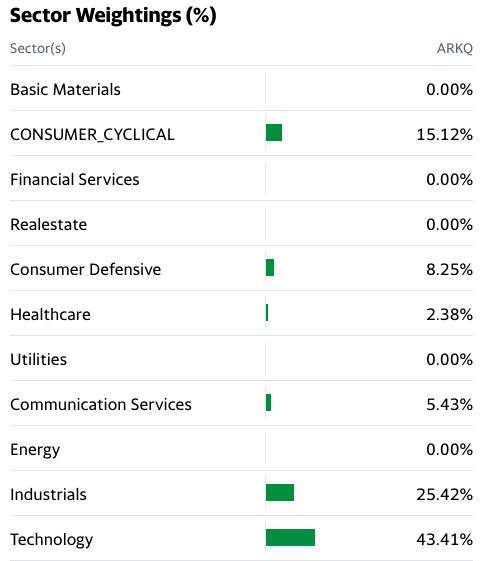
It's fairly well-diversified among a handful of sectors, most notably technology (XLK), industrials (XLI), and consumer discretionary (XLY), which account for roughly 84% of the holdings. I'm a fan of these three sectors, so I'd say this ETF gets a "thumbs up" for inclusion in my portfolio. I'd go one step further, however. How heavily concentrated in individual stocks is the ARKQ? And which stocks are the largest positions?
Here's that detail, again from Yahoo Finance:
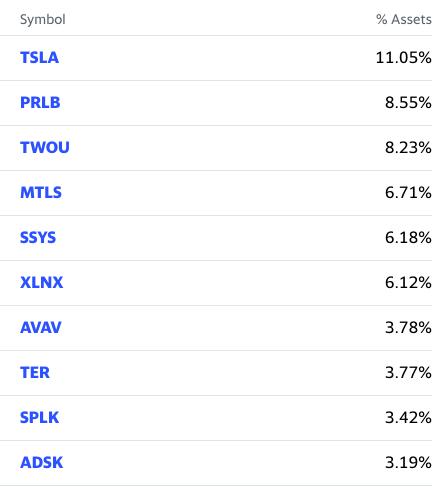
These top 10 holdings represent 60% of the entire portfolio. That might be a good thing or a bad thing, depending on your own strategy. For me, TSLA is one of my favorite stocks, so I like the weighting here. PRLB, the second-largest holding, has a very strong chart:
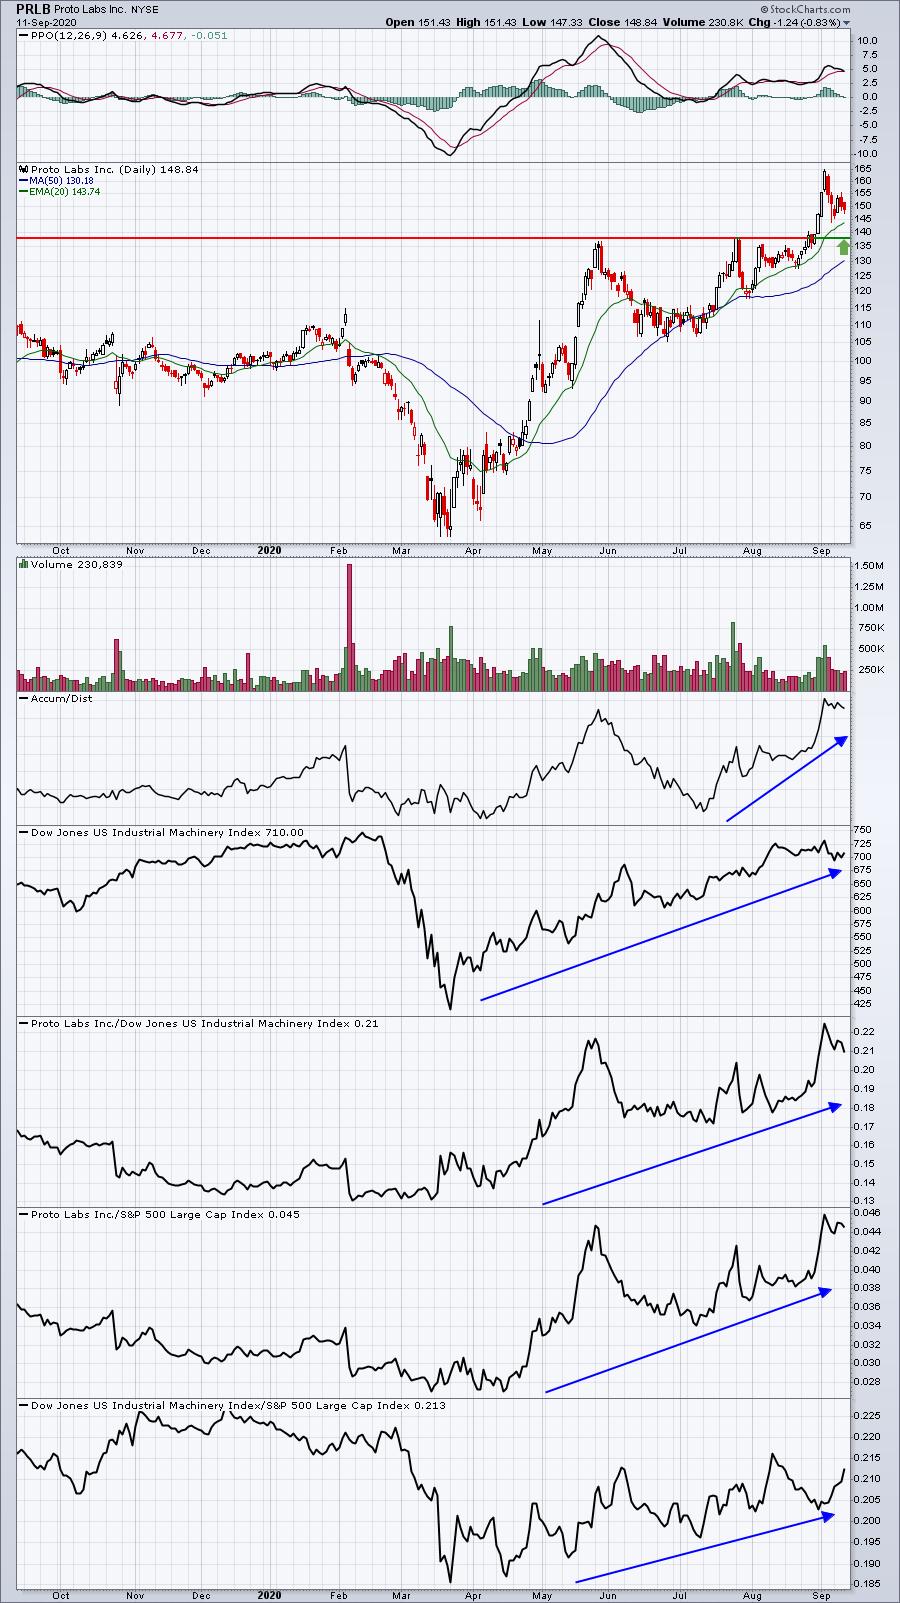
Honestly, this is my kind of chart. Note all of the lower panels are rising from left to right, suggesting that PRLB is a leading stock within a leading industry group. The more of these I have in an ETF, the more I'm going to like the ETF.
Conclusion
Do your homework. You MUST know what you own and whether an ETF fits your style, strategy, and objectives.
Or you can let EarningsBeats.com do your homework for you. We will be announcing some exciting news regarding ETFs in the very near future, and we want you to be aware and a part of these exciting developments. To join our community of thousands of traders and to be kept apprised of future ETF developments, please subscribe to our EB Digest newsletter. It's 100% free (no credit card required) and you may unsubscribe at any time, no questions asked. CLICK HERE to start your free subscription today!
Happy trading!
Tom
