At the start of the week, I held a members-only webinar at EarningsBeats.com to provide my "predictions" of upcoming earnings reports based off of the charts. I've turned it into a formal study where I've been summarizing results all week. The best charts were expected to see stronger-than-expected revenue and EPS, and hopefully, better performance after those results were released. The worst charts were expected to see the opposite - plenty of revenue and EPS misses accompanied by not-so-great price action.
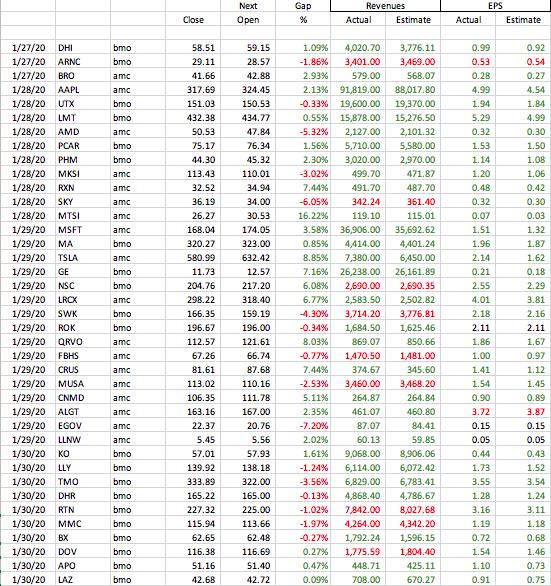
The first list comprised 39 stocks that appeared technically to suggest a strong earnings report was forthcoming. I expected to see revenue and EPS beats and better performance. Beats are shown in green, while misses appear in red. Here were the results of the "strong" list:

Let's summarize the results:
- Beat revenue estimates: 30 of 39 companies
- Beat EPS estimates: 34 of 39 companies (3 matched estimates, 2 missed)
- Gapped higher at next open: 23 companies, averaging +4.13%
- Gapped lower at next open: 16 companies, averaging -2.49%
- Cumulative return if $10,000 was invested in all "strong" positions above at the close prior to earnings, selling at the next opening bell: +$5,497.50
The second list that I gave to EarningsBeats.com members comprised 8 companies that were very weak relative performers heading into their earnings reports. I expected a much higher level of missed revenues, missed EPS and negative reactions. Here were the results of the "weak" list:

Let's summarize these results:
- Beat revenue estimates: 3 of 8 companies
- Beat EPS estimates: 2 of 8 companies (1 matched estimate, 5 missed)
- Gapped higher at next open: 1 company (BA), which gapped up 2.40%
- Gapped lower at next open: 7 companies, averaging -4.18%
- Cumulative return if $10,000 was used to short all "weak" positions above at the close prior to earnings, covering those positions at the next opening bell: +$2,688.20
If $10,000 were invested on the long side for the strong stocks and the weak stocks were shorted for that same $10,000, it would have yielded a total profit of $8,185.70. I'd say that this is a reasonable way to approach earnings. Hold into earnings if the charts say to. Otherwise, move to cash or short if they're among the very weak. What's not shown above is that there were hundreds of companies that I honestly didn't have much of an opinion on as their earnings dates approached. I felt those were more of a 50/50 coin toss heading into earnings reports.
This Saturday, February 1st, I'm hosting a 2pm EST webinar to discuss an excellent new ChartList-sharing feature at StockCharts, but I'll also be preparing an earnings encore as I look ahead to earnings reports next week. I will discuss all of these companies (and their charts) during the webinar and I'll send EB members, including $7 trial members, the ChartLists that comprise all charts discussed. (By the way, our $7 30-day trial is actually free for a limited time. You'll be charged $7 initially, but we'll refund that amount.) I only ask that you be at least a FREE EB Digest subscriber to attend the webinar, however. I publish brief articles Mondays, Wednesdays, and Fridays, in the EBD Digest, highlighting earnings and relative strength. It's a very educational newsletter that, again is completely free.
I hope you can join me on Saturday. I'll provide links to our webinar room in articles between now and Saturday, as well as posting it on our website, www.earningsbeats.com. If you join the webinar without first becoming an EB Digest subscriber, you agree to authorize us to add you to this free newsletter. I believe it'll be a very enlightening webinar that can really help you as you approach earnings reports for stocks that you own.
Happy trading!
Tom
