Hey, I'm bullish longer-term so I'm not talking about a major bear market ahead, nothing like that. But as a short-term trader, I need to heed the signs of a potential top and I'm beginning to see them. There are a number of these signals and I plan to discuss all of them later this afternoon, but for right now, let's just consider the negative divergences that have formed on two different time frames.
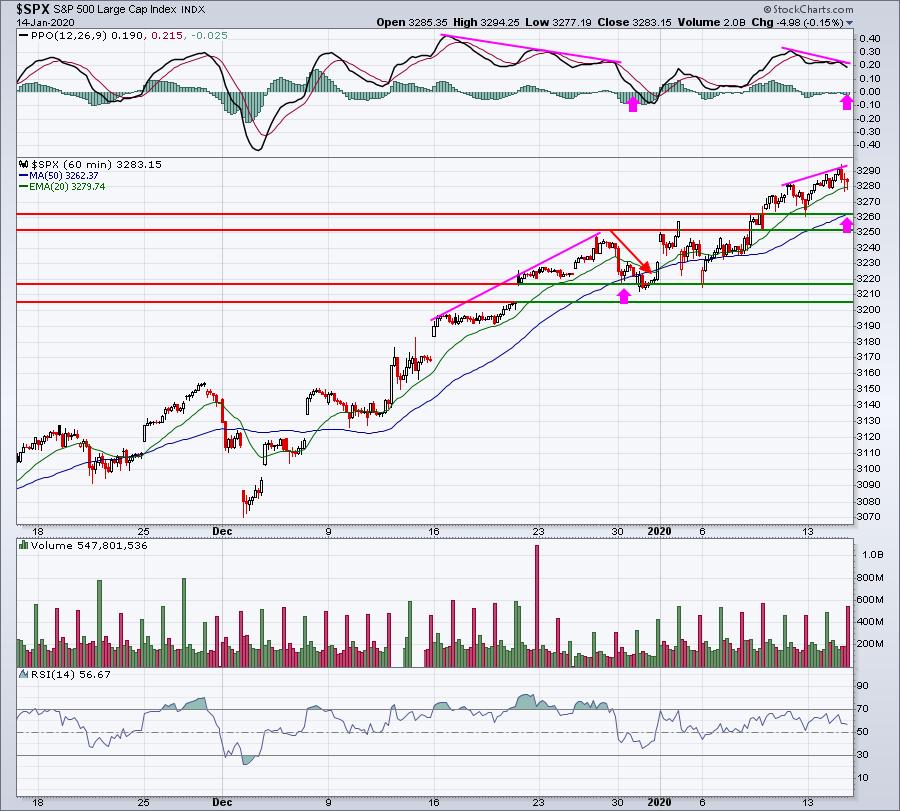
First, let's check out the hourly negative divergence on the S&P 500:

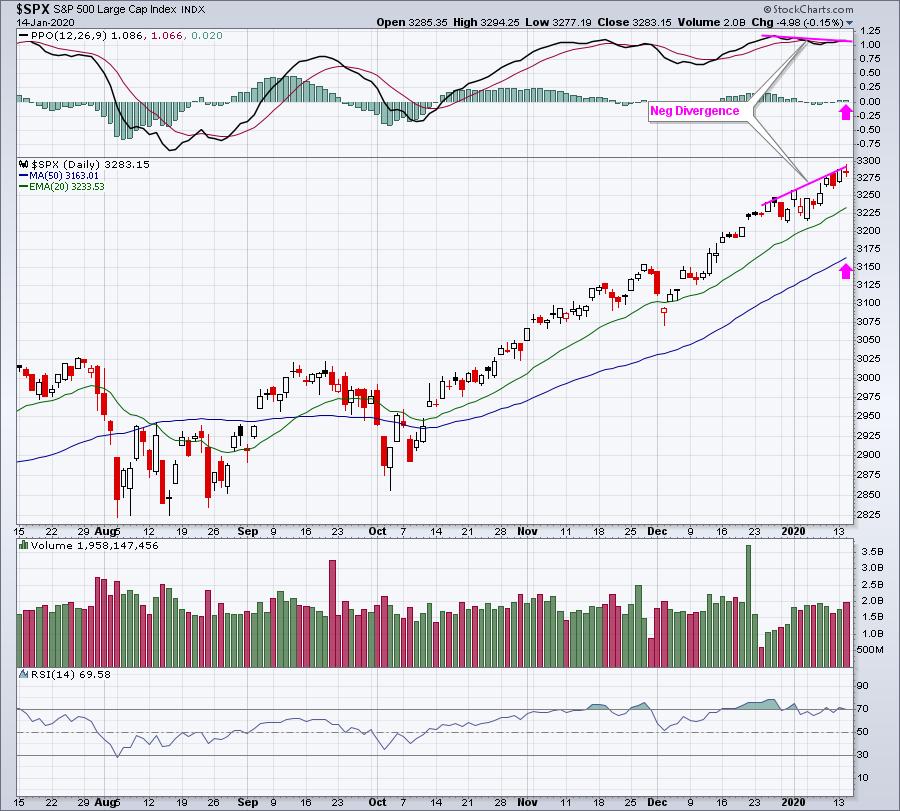
We had a similar negative divergence in December and you can see that there was selling, but it was mostly contained by the 50 hour SMA. It's not unusual for these hourly divergences to "play out" over the course of 2-3 days. This one, however, could lead to more substantial selling as it's also accompanied by a negative divergence on the daily chart as well:

Negative divergences on daily charts can play out over much longer periods, perhaps 2-3 weeks. It wouldn't be unusual to see the stock market go through a period of "buy on rumor, sell on news" and that could be setting up here as earnings season kicks off.
There are other major warning signs as well that deal with extreme sentiment readings, options expiration, and historical patterns. I'll be discussing all of this in an impromptu webinar for EarningsBeats.com members at 4:30pm EST today. There aren't many things more important to a short-term trader than identifying a potential market top and locking in trading profits. Hopefully, I can shed some light on that process later today.
CLICK HERE for more information on how to participate in this timely webinar. The webinar will be recorded for those unable to attend the event live.
Happy trading!
Tom
