I established an Aggressive portfolio of 10 equal-weighted stocks in 10 different industry groups on May 19th. Every 3 months thereafter, on August 19th and then again on November 19th, I repositioned the portfolio with new relative leaders. That's the concept behind the portfolio. Stick with leaders in leading industries and make changes every three months. You're always invested in leaders. Consider the makeup of this Aggressive portfolio each quarter thus far:
May 19, 2019:
- 4 small cap
- 2 mid cap
- 4 large cap
August 19, 2019:
- 3 small cap
- 5 mid cap
- 2 large cap
November 19, 2019:
- 5 small cap
- 4 mid cap
- 1 large cap
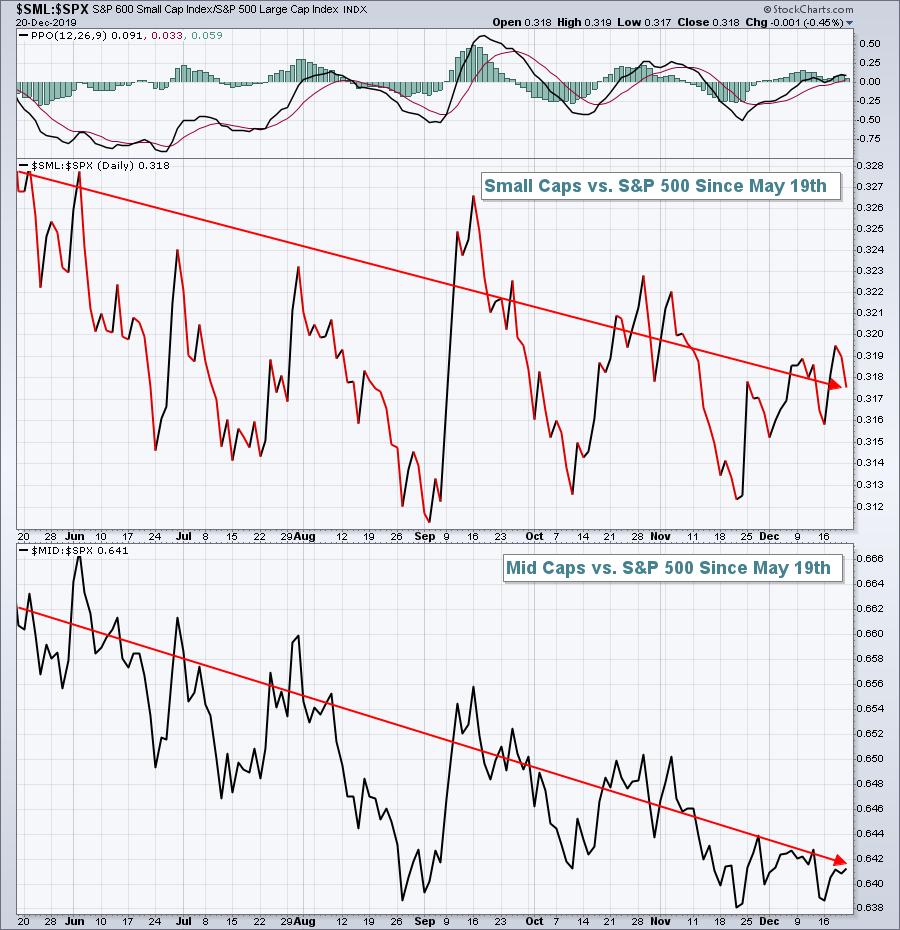
You can see that this portfolio has been heavily skewed toward small and mid cap stocks. Now consider how small and mid caps have performed relative to the much larger cap S&P 500 since the inception of my Aggressive portfolio:

This portfolio has faced major headwinds, yet the results have been quite strong.
Since the May 19th inception:
- S&P 500: +12.65%
- Aggressive Portfolio: +16.77%
That's not bad performance at all when we consider the market environment since May, which has clearly favored larger cap stocks.
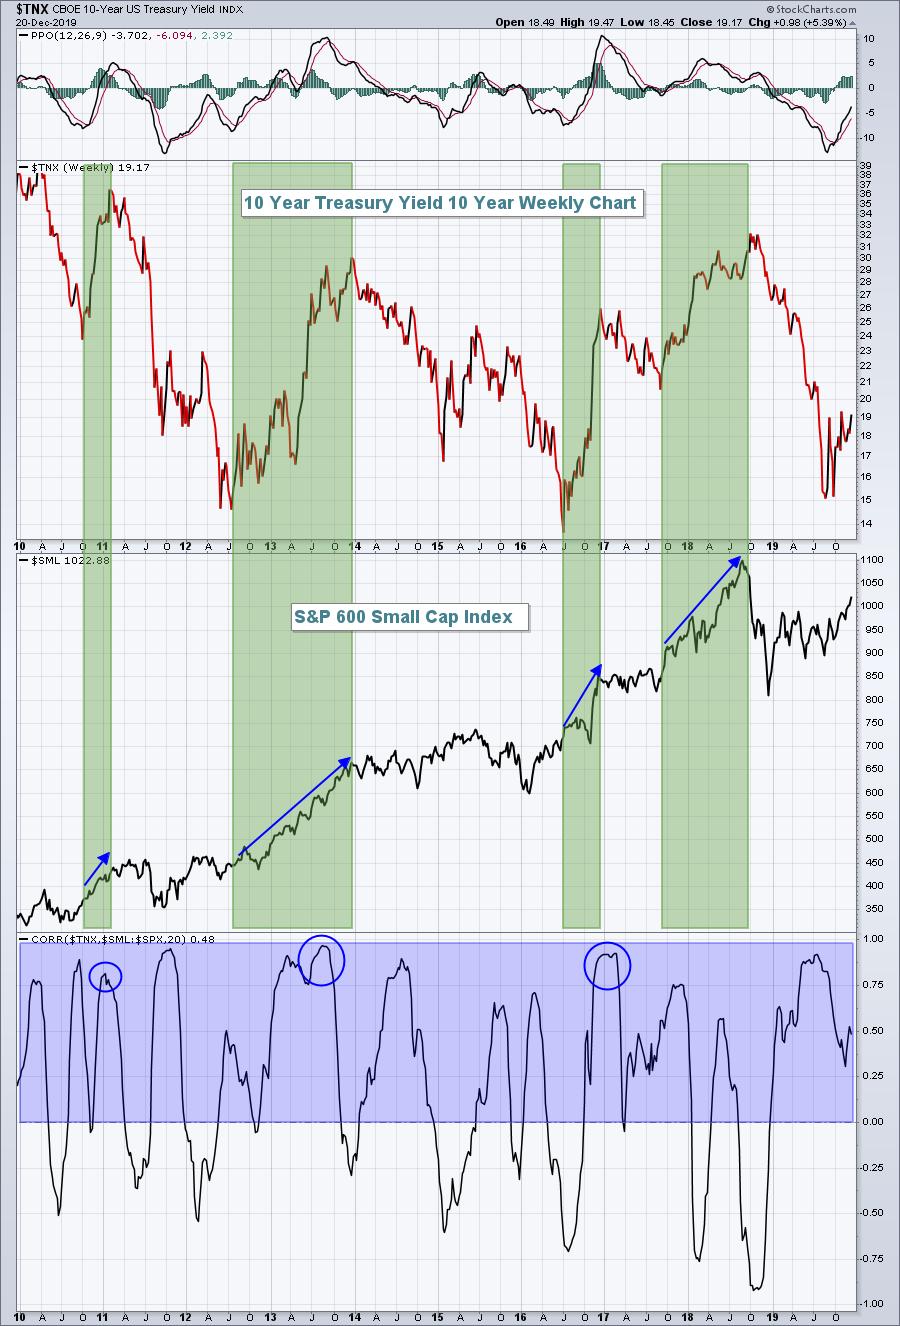
So why might smaller caps soar? Well, any time the 10 year treasury yield ($TNX) is rising, it's generally a good sign of domestic economic growth. The S&P 600 Small Cap Index ($SML) is comprised of companies that do most, if not all, of their business domestically. The following chart will help to illustrate how small caps perform when the TNX is rising:

Concentrate on the green-shaded areas. That represents the times when the TNX has been rising rapidly over the past decade. As you scroll down on that chart, you'll also see that the SML tends to perform extremely well during those periods on an absolute basis. The correlation coefficient in the bottom panel shows that during 3 of those 4 big moves higher in the TNX, the relative performance of the SML:SPX was trending in the same direction as the TNX. In other words, when the TNX is moving up, you want to be represented by small and mid caps. I currently believe we'll see a higher TNX in 2020.
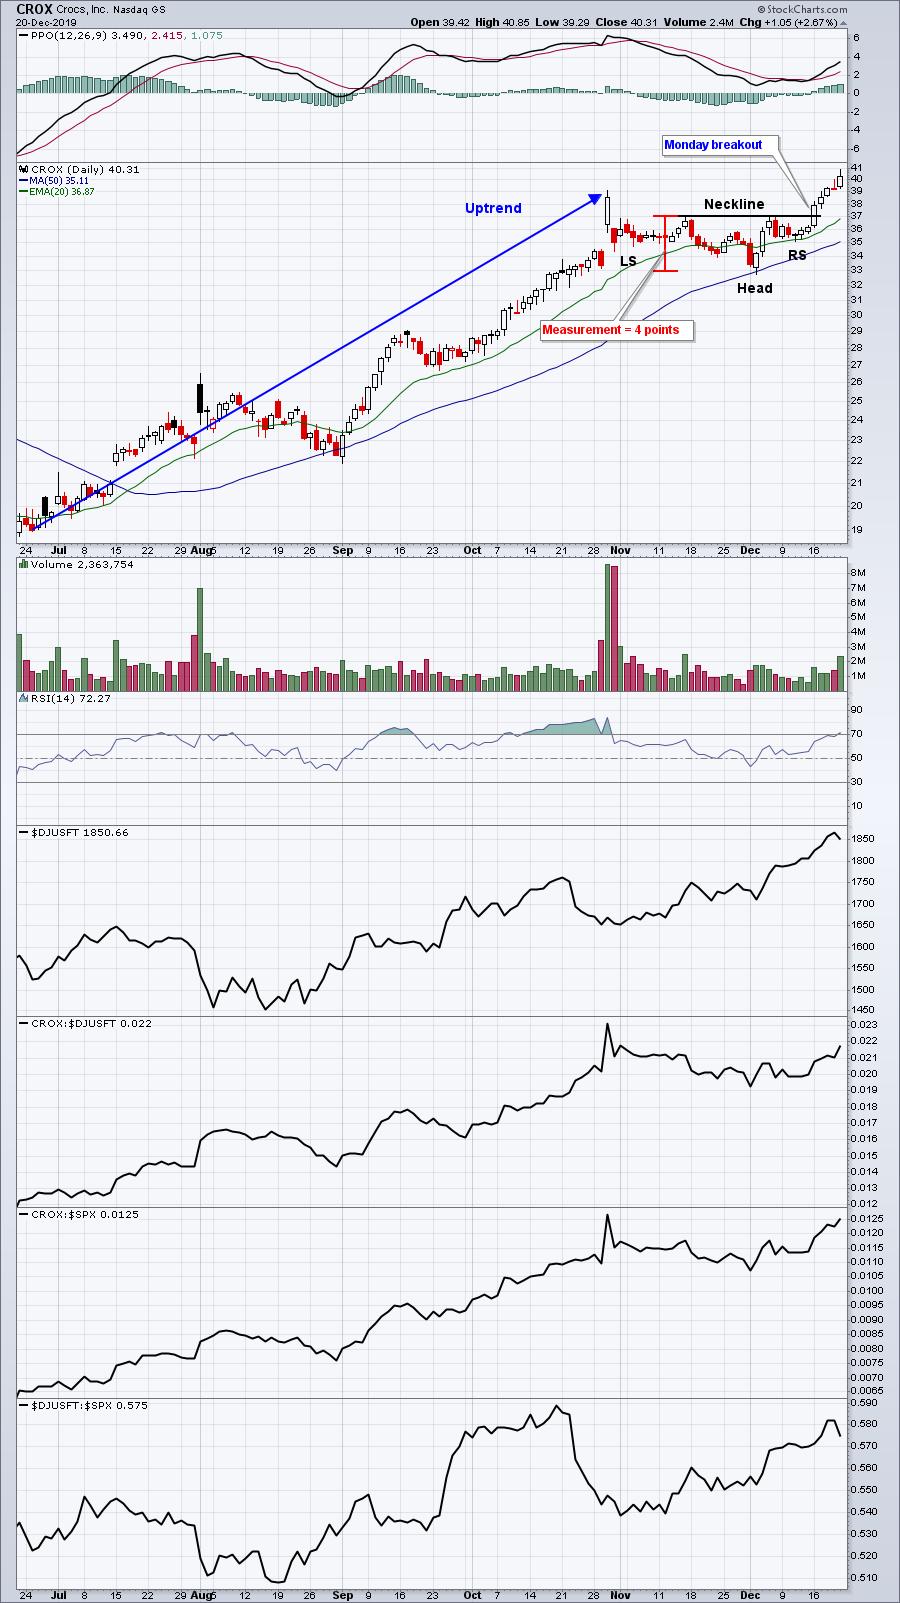
My top performer in the Aggressive portfolio right now is Crocs, Inc. (CROX), which broke out last week of a bullish inverse head & shoulders continuation pattern as follows:

The Aggressive portfolio entered CROX at 34.80 on November 19th and it's been a very solid performer since.
Would you like to see all 10 stocks currently held in this portfolio? I'm willing to send you a link to all 10 stocks in this portfolio, with annotated charts. If you're a StockCharts.com Extra member or above, you'll be able to download these charts into a ChartList. Otherwise, you'll simply be able to view them. Send me an email at "tom@earningsbeats.com" and write in the subject line "Aggressive Portfolio". I'll provide you the link and add you as a free EarningsBeats.com Digest newsletter subscriber. As a free subscriber, you'll receive brief articles 3 times per week (Mondays, Wednesdays, and Fridays) educational in nature. Topics generally include earnings and relative strength and how I use both in my trading.
Happy trading!
Tom
