Special Note
I'm on vacation this week, so my articles are in a different format and generally shorter. There will be no blog article on Friday.
I've created three portfolios over the past year. My Model Portfolio began on November 19, 2018 and my Aggressive Portfolio and Income Portfolio both started on May 19, 2019. They've all performed at a very high level. While the nature of the stocks is different among portfolios, there's one common thread - relative strength. All 30 stocks included in these portfolios have demonstrated the ability to outperform the benchmark S&P 500. I put a lot of research initially into stocks that beat Wall Street's consensus estimates at to both revenue and earnings per share (EPS). I then take those stocks with proven fundamental track records and evaluate their charts. A big part of my evaluation is relative strength.
My entire process takes hundreds of hours throughout the calendar year. But I understand that not everyone has hundreds of hours to time to monitor stocks and adjust portfolios. If you're in that camp, this article is for you.
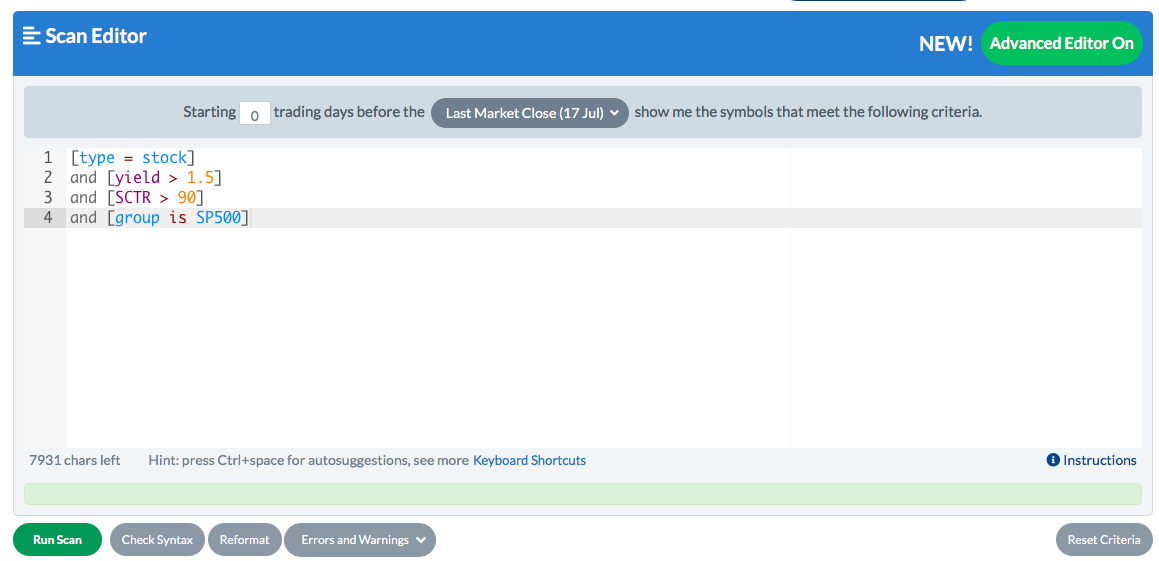
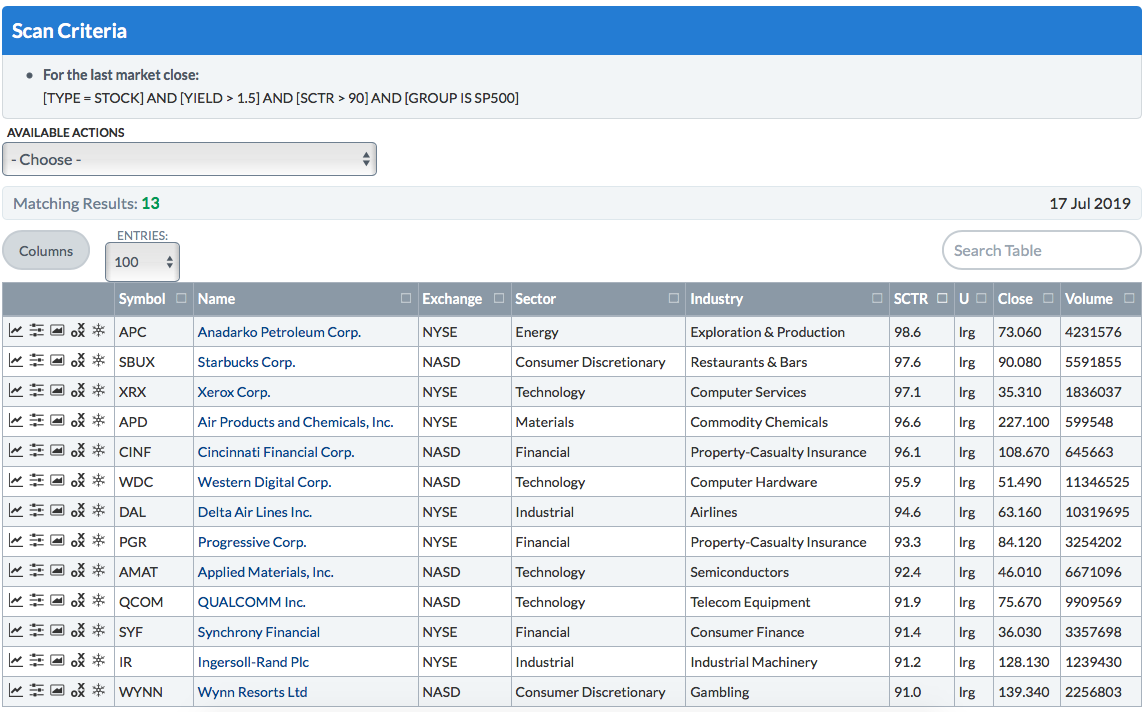
Let's say that you're an income-oriented investor and require a minimum dividend yield of a 1.5%. Furthermore, you want the relative safety of S&P 500 stocks. How do you find the best relative performers that meet that criteria? What do you do? Do you look at all 500 stocks? I'd say no. Use the powerful StockCharts.com scan engine to help reduce your analysis time. StockCharts Technical Rank scores (SCTRs) are a very quick way to identify relative strength. I, within seconds, found 13 solid candidates that could fit the bill.
Here was my scan criteria:
 ....and here were my results:
 I'm not a fan of energy and materials right now, so I'd throw both of those out and that leaves me with 11 stocks to choose from - much more manageable than the 500 I started with.
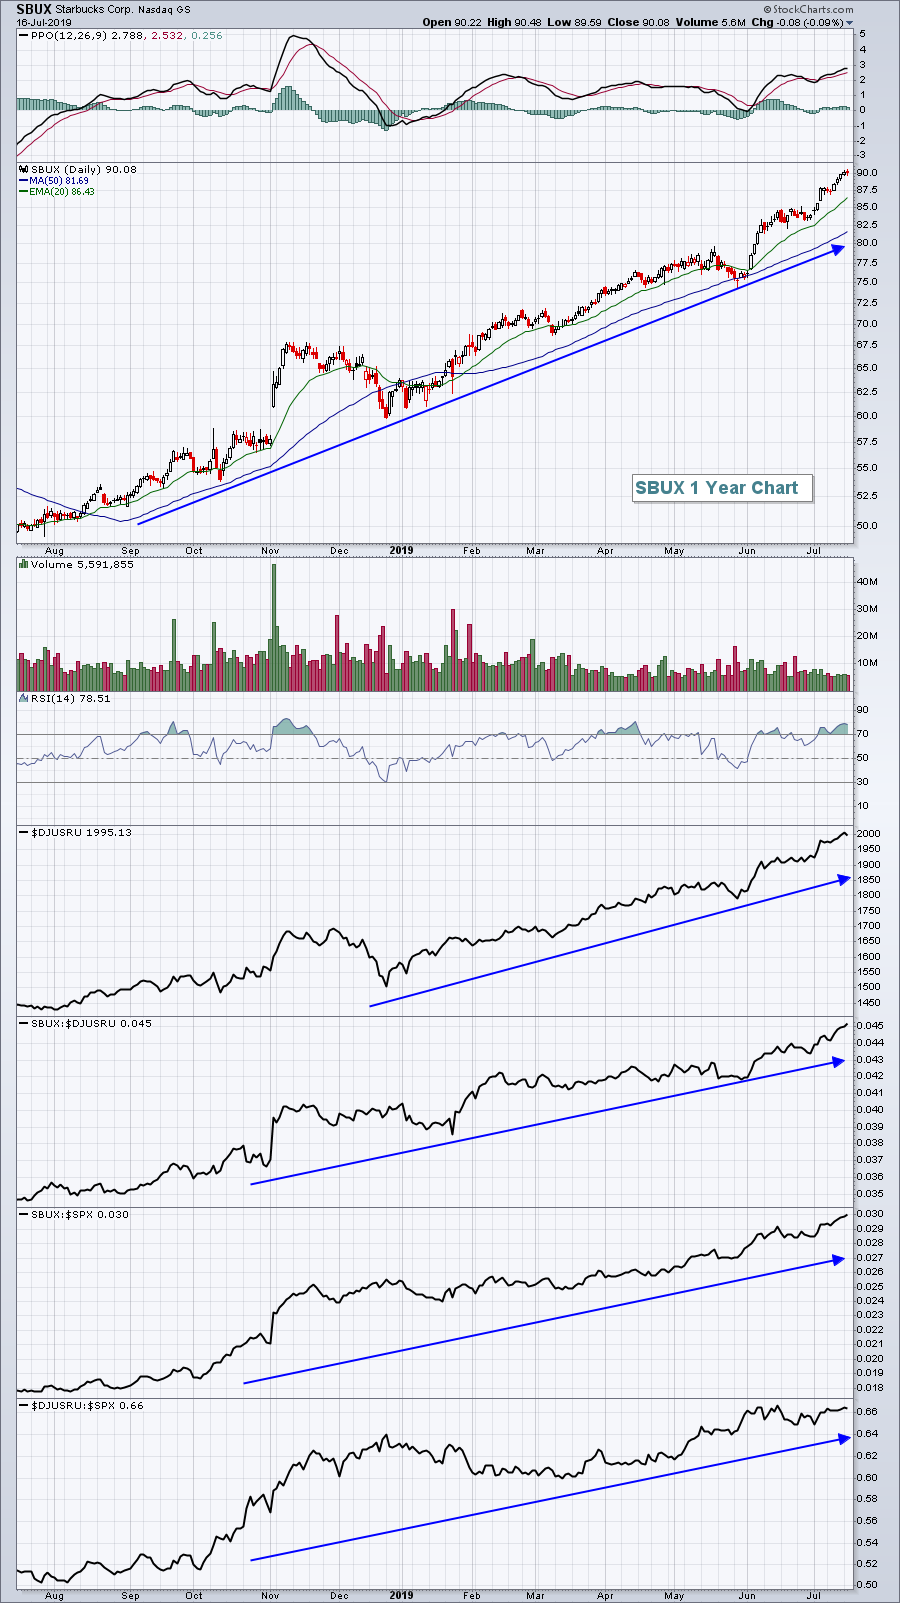
My favorite, without a doubt, is Starbucks (SBUX). Not only has SBUX been a great performer, but it also carries a 1.6% yield and is part of one of the hottest industry groups - restaurants & bars ($DJUSRU). Check out this chart:
 When SBUX shows a bit of absolute and relative weakness, it's time to jump in. Early-March and late-May were two great examples. Wall Street lets us know when they're accumulating and they also let us know when they're not. Relative strength is our key to unlocking the answer.
My friend John Hopkins made a couple of bold predictions in his last ChartWatchers article. One was betting on a blowout report from Cintas Corp. They reported their latest quarterly earnings after the bell yesterday with an EPS of $2.07. The consensus estimate? $1.94. Was it a lucky guess? No, he did his homework. They also beat revenue expectations and the stock was up significantly after hours last night. CTAS has been an awesome relative performer and Wall Street had placed its bet on CTAS. John simply saw it and went along for the ride. The EarningsBeats.com Digest newsletter is FREE and focuses on this type of opportunity. It's a GREAT value as it costs nothing. Do yourself a favor and SIGN UP if you haven't already.
Happy trading!
Tom
