Market Recap for Friday, May 31, 2019
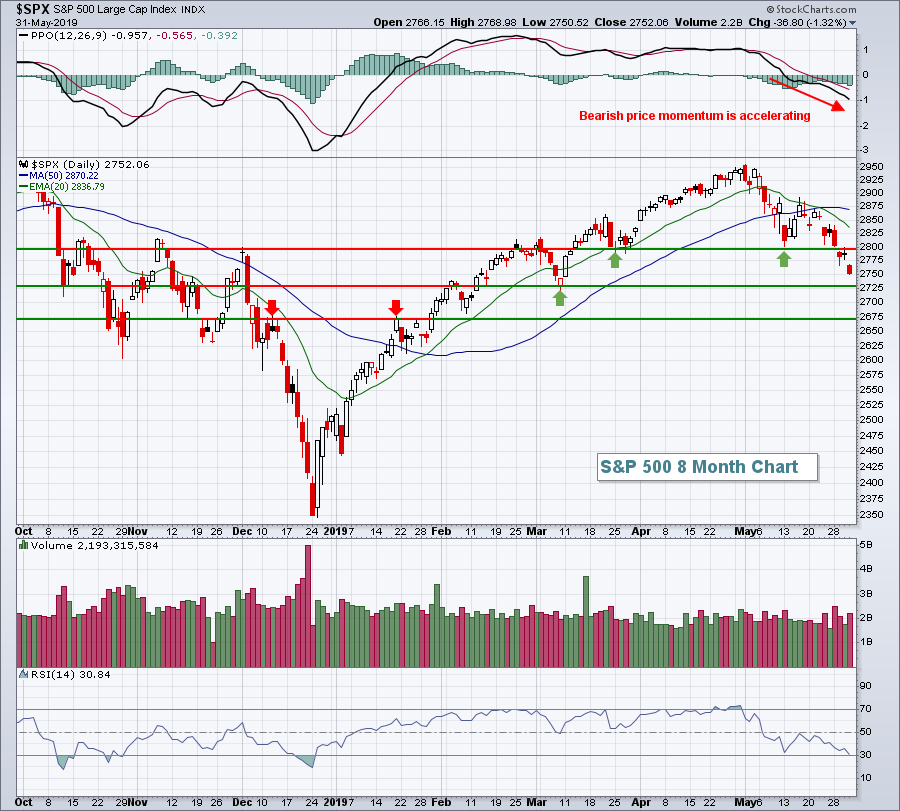
The U.S. stock market was in no mood for any negative surprises, yet it received one when President Trump slapped a 5% tariff on all products from Mexico (effective June 10th) to try to control illegal immigration. While it may seem as a minor tariff, President Trump promised to increase those tariffs periodically. After all the back and forth over trade with China, the new tariff on Mexican products was the last thing the stock market wanted to see. As a result, the selling escalated with the S&P 500 falling 37 points, or 1.32%, continuing its May swoon:
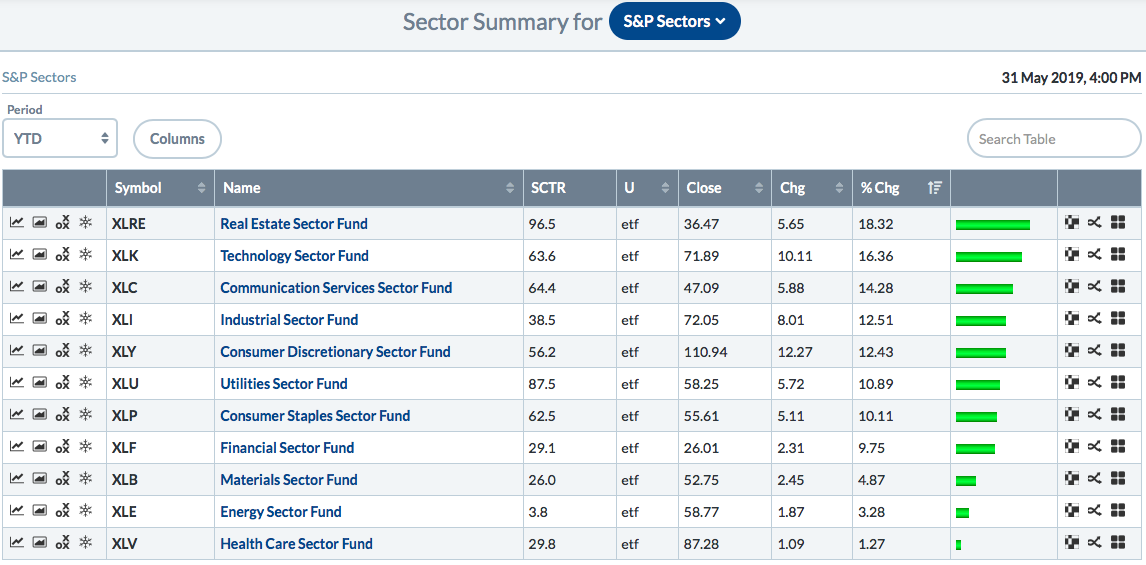
 Two defensive sectors - real estate (XLRE, +0.83%) and utilities (XLU, +0.47%) - managed to escape the sellers' wrath, but the other nine sectors were not so fortunate. Energy (XLE, -1.76%) was the primary laggard once again, but had plenty of company on Friday. Technology (XLK, -1.67%), communication services (XLC, -1.55%) and financials (XLF, -1.51%) all fell more than 1.5% on the session.
Autos ($DJUSAU, -2.90%) and auto parts ($DJUSAT, -3.62%) were directly impacted by the new 5% tariff. The former gapped down on Friday to close at a fresh new low, clearing the support established in October 2018 and nearly retested in December 2018:
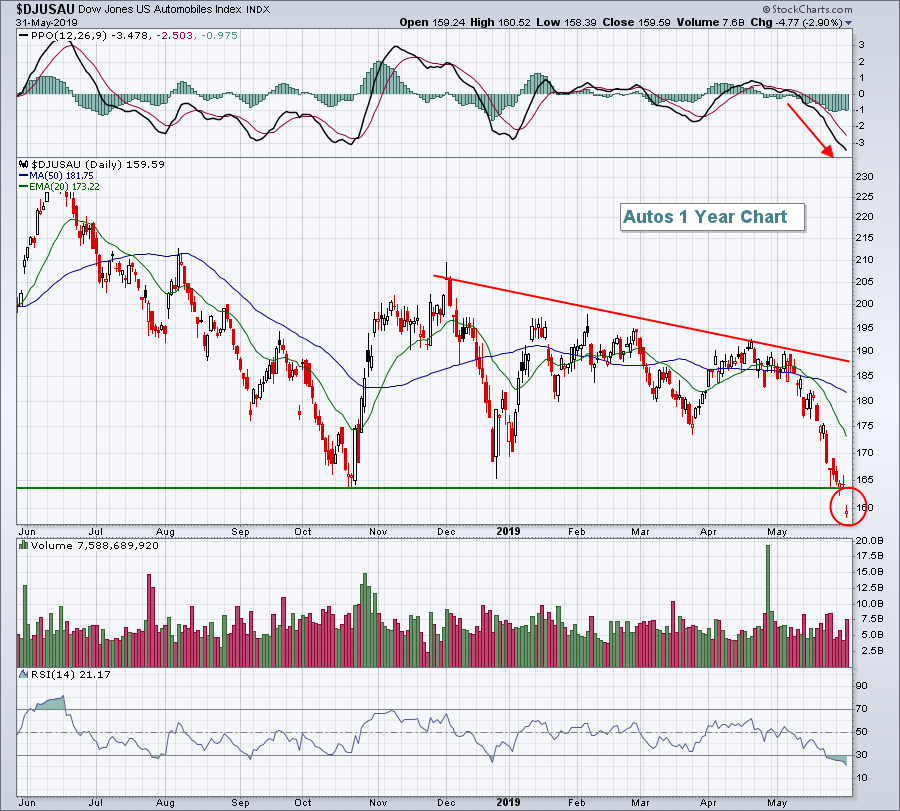 While we should expect a bounce soon because of extremely oversold conditions, that bounce is not likely to last given the PPO, which is negative and accelerating rapidly.
Pre-Market Action
Crude oil prices ($WTIC) are rebounding this morning to the tune of nearly 2% after a bevy of selling on Thursday and Friday of last week. The 10 year treasury yield ($TNX) is continuing its downward spiral, lower by another 2 basis points to 2.12% this morning. Gold ($GOLD) has been benefiting from the renewed stock market fears and is climbing another $11 to $1322 per ounce in early trading.
Dow Jones futures are set for another drop at the open today, down 51 points with 30 minutes to the opening bell.
Current Outlook
In addition to evaluating the technical conditions of our major indices, it's also very important to me to watch relative strength of industries relative to the benchmark S&P 500. The reason? I want to know the groups that Wall Street is favoring so that when I'm comfortable the overall market is trending higher, I can limit my trading to stocks within those strong groups.
As an example, telecom equipment stocks ($DJUSCT) reside in the technology sector (XLK), which has been the second-best performing industry group (behind real estate):
 .....and here's the relative chart for the DJUSCT:
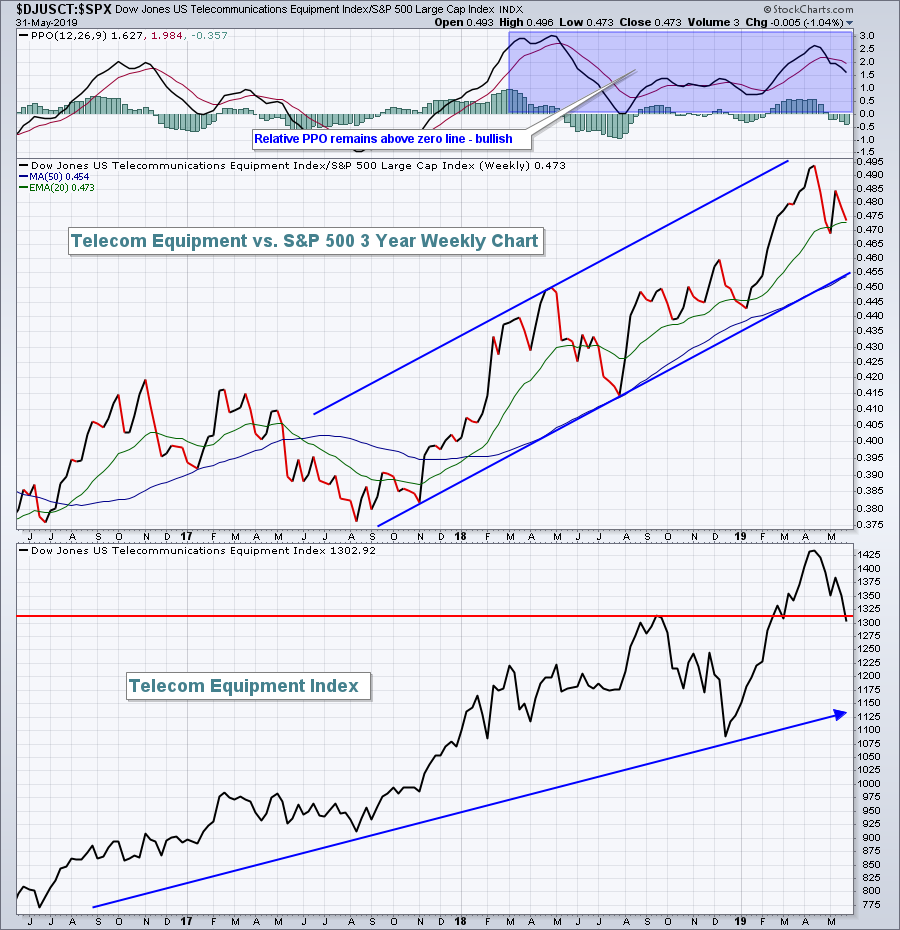 I look to the relative PPO as a signal of strength or weakness. If the relative PPO is above zero, it's generally going to be an industry group that I'm interested in. If it's below zero, then I'm likely to have reservations about an individual stock trade within the group. To give you an analogy, think about swimming upstream vs. downstream. It's much easier to swim fast downstream. In the stock market, it's much easier to make money in a group that is seeing money inflows.
Sector/Industry Watch
The consumer discretionary sector (XLY) has been one of the best relative performing sectors in 2019, but it's no thanks to gambling stocks ($DJUSCA), especially over the past five weeks. While the XLY has significantly outperformed the benchmark S&P 500 in 2019, the DJUSCA has not:
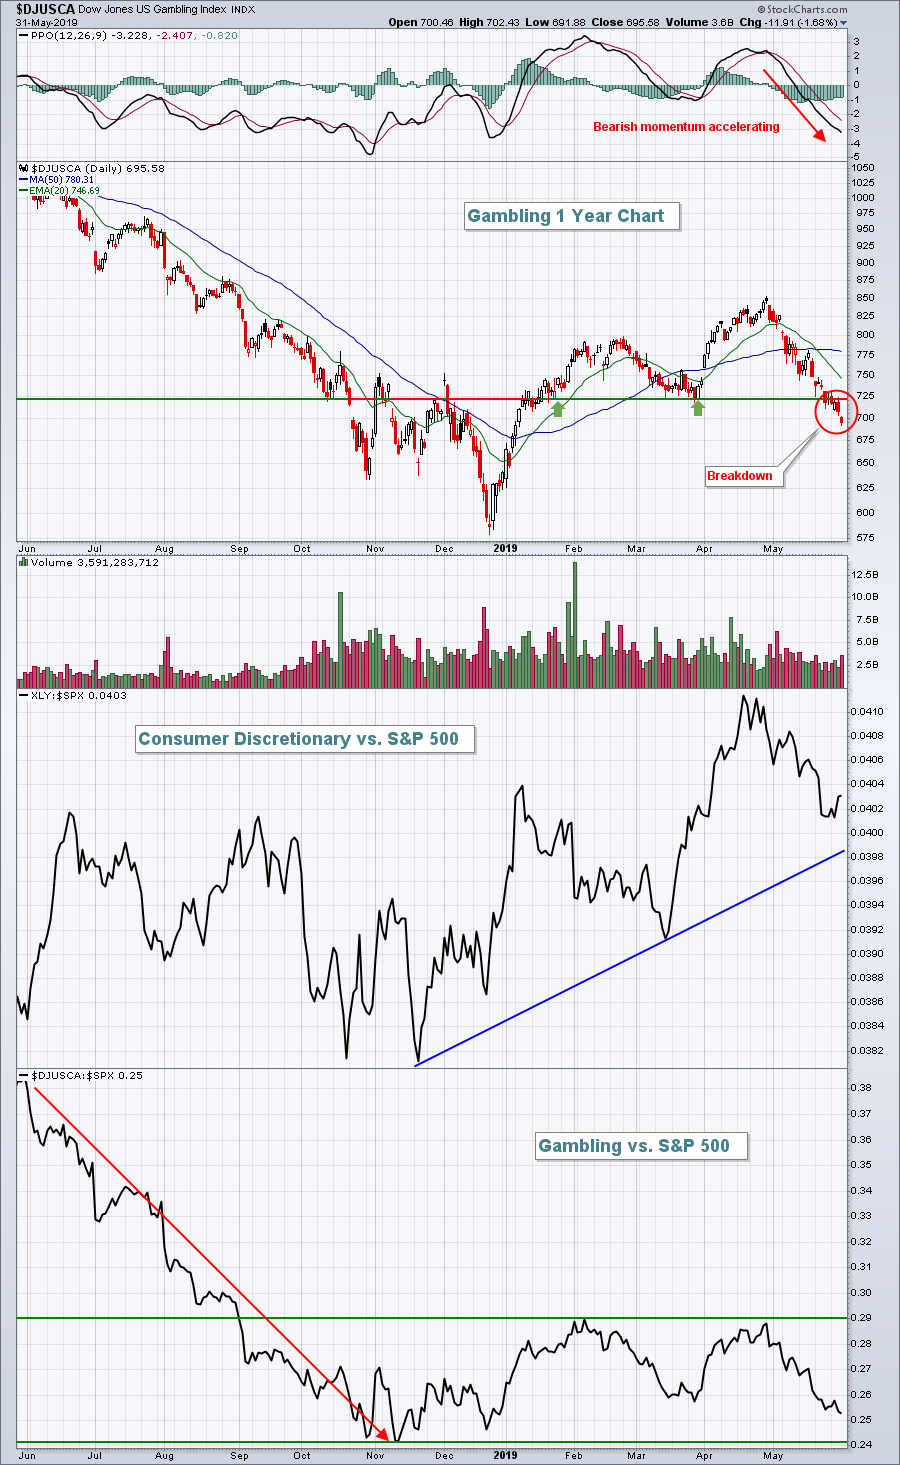 The above chart, combined with the Historical Tendencies information below, tells me one thing quite clearly. Right now, I want to look elsewhere in consumer discretionary for trading ideas. Gambling stocks are broken technically. Avoid the group until technical repair takes place. If Wall Street is ignoring this area of the market, there's a reason and we'll likely find out why during this bearish month.
Monday Setups
ViaSat (VSAT) gapped up on strong quarterly results a week ago and touched 97.50. Since then, this telecom equipment stock has fallen back to fill its gap near the 87.50 level. There's fairly solid price support at 85, which I would expect to hold. Therefore, I'd consider entry at the current price and again at 85 with a closing stop beneath that level. For a target, look for a return to the 97.50 level. Here's the visual:
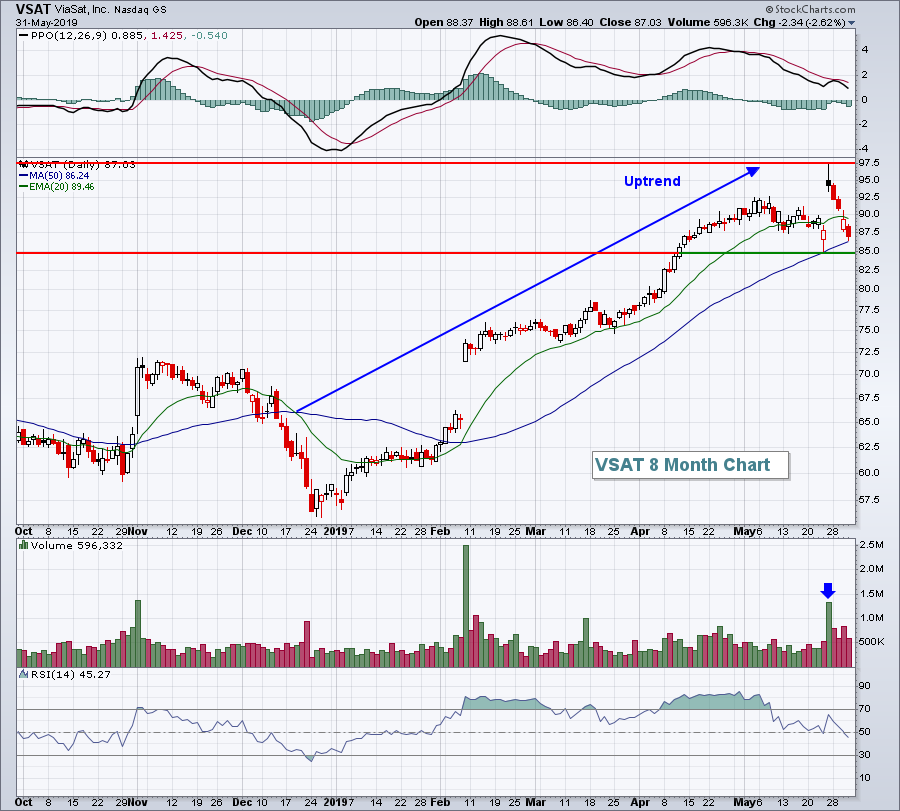 The high at 97.50 was established with a shooting star candle, which is a reversing candle off of an uptrend. The heavy volume on the reversal added an element of short-term bearishness as well. I'm expecting VSAT to consolidate in this range, but I'll also be keeping an eye on the $DJUSCT:$SPX relative strength. I've provided a relative strength chart on the DJUSCT in the Current Outlook section above.
Historical Tendencies
If you buy into the gambling industry ($DJUSCA) in June, you're most definitely taking a gamble. The DJUSCA has a very poor history in June as you can see from the seasonality chart below:
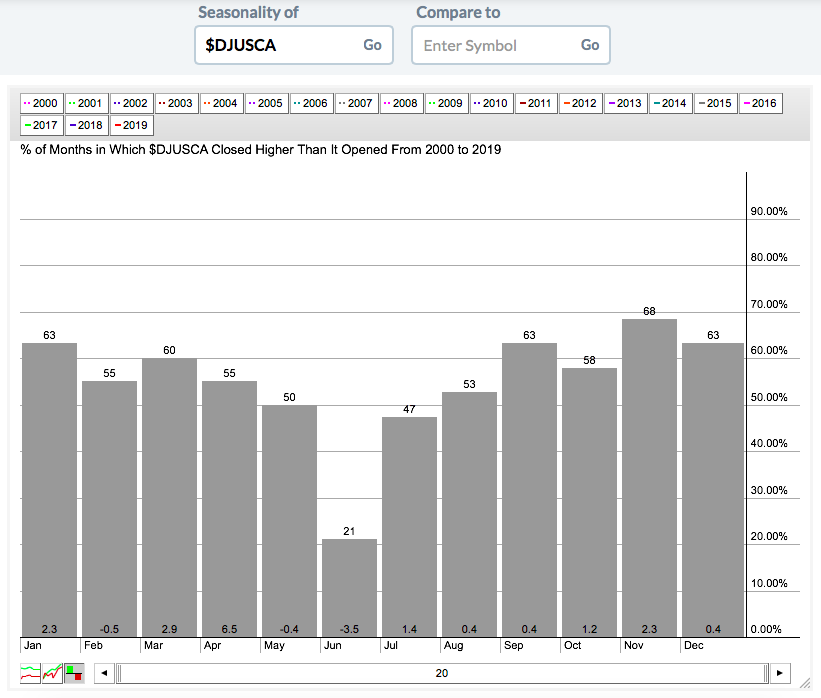 There have only been 3 calendar months with average returns in negative territory and the other two - February and May - have been fractional losses. There's nothing close to the bearish month of June, where the DJUSCA has risen only 1 of 5 Junes historically and has averaged losing 3.5% per June over the past two decades.
Key Earnings Reports
(reports after close, estimate provided):
COUPA: (.04)
BOX: (.05)
Key Economic Reports
May PMI manufacturing index to be released at 9:45am EST: 50.6 (estimate)
May ISM manufacturing index to be released at 10:00am EST: 52.9 (estimate)
April construction spending to be released at 10:00am EST: +0.5% (estimate)
Happy trading!
Tom
