Market Recap for Wednesday, June 12, 2019
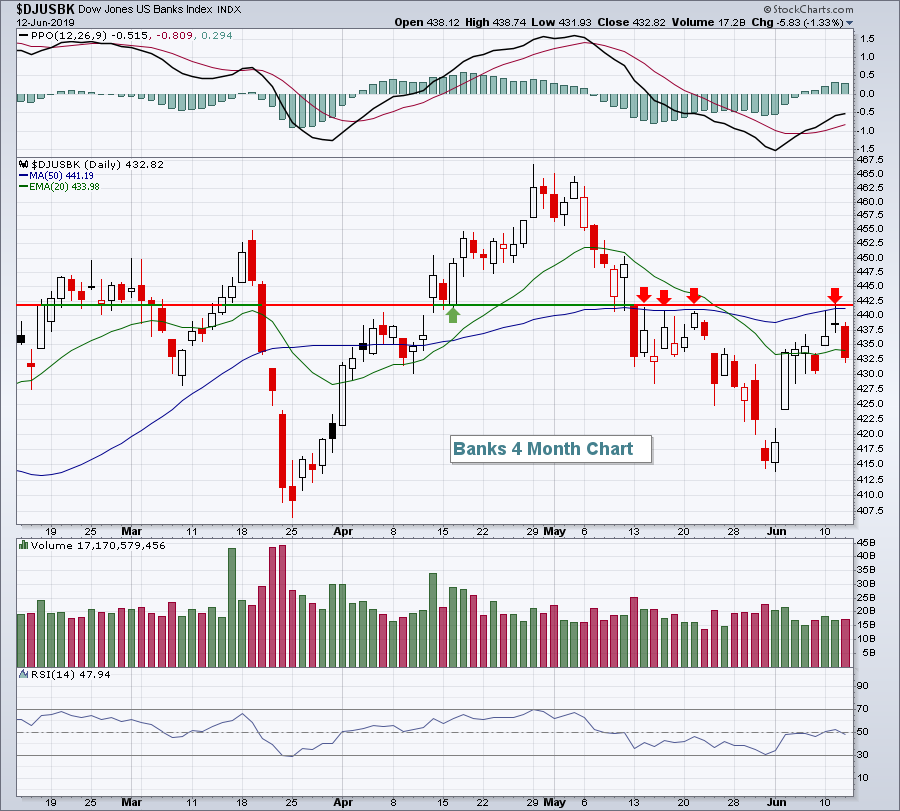
We ended Wednesday with bifurcated action as the small cap Russell 2000 ($RUT, +0.05%) was able to eke out a tiny gain. The other major indices, however, were not so fortunate with the NASDAQ ($COMPQ, -0.38%) falling a bit more than the S&P 500 ($SPX, -0.20%) and Dow Jones ($INDU, -0.17%). Sectors were mixed as well, with the obvious laggards being energy (XLE, -1.41%) and financials (XLF, -0.99%). Banks ($DJUSBK, -1.33%) struggled with a small drop in the 10 year treasury yield ($TNX) and once again failed at stubborn price resistance:
 Since gapping down in mid-May, 442 has proven to be very difficult price and gap resistance to negotiate. I'd be careful in this space until that level is cleared on a closing basis.
The bigger problem yesterday, however, was energy. Bearish crude oil inventory data sent prices much lower, triggering yet another day of selling in energy stocks. I look a little closer at energy in the Sector/Industry Watch section below.
Meanwhile, it wasn't bearish everywhere. Six sectors managed to gain ground on Wednesday, although industrials (XLI, +0.21%) represented the only aggressive sector to end in positive fashion. Instead, defensive groups mostly led the parade of winners, including utilities (XLU, +1.40%) and healthcare (XLV, +0.48%).
Pre-Market Action
Crude oil prices ($WTIC) are jumping nearly 4% after reports of suspected tanker attacks in the Gulf of Oman, while the 10 year treasury yield ($TNX) is down 2 basis points to 2.11% following a rise in initial jobless claims.
Asian markets were relatively unchanged overnight, while European markets are higher. Dow Jones futures are reacting to the strength in Europe and are higher by 76 points as we approach today's open.
Current Outlook
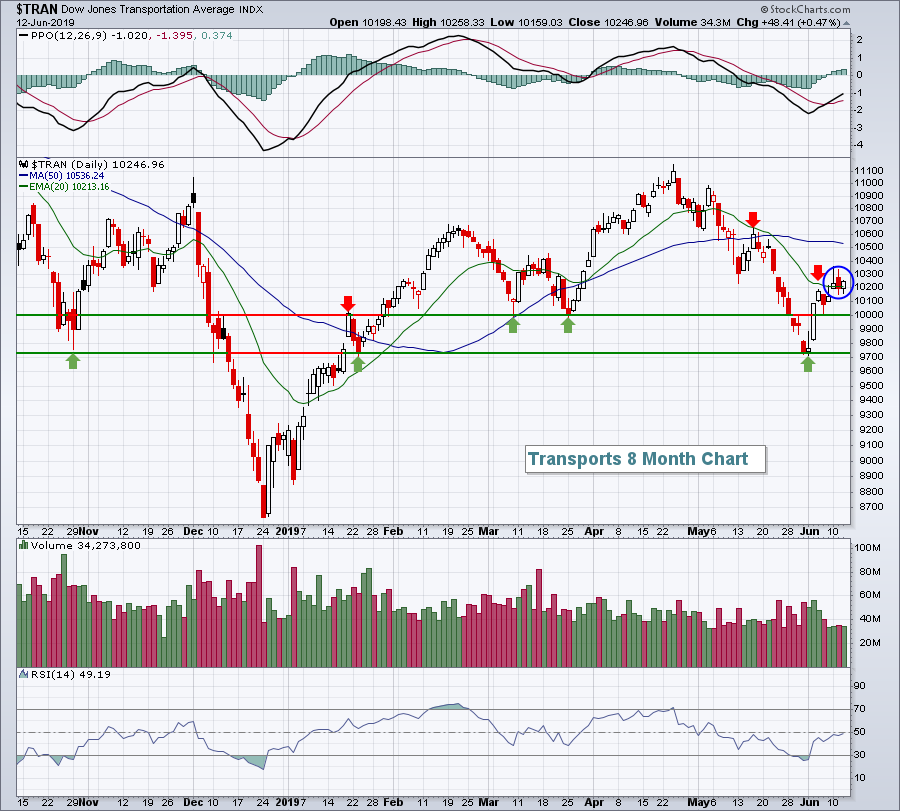
Transportation stocks ($TRAN) are always an important area of the stock market to pay attention to. If you disagree with me, then read up on the Dow Theory, which suggests a very important relationship historically between the Dow Jones Industrials and the Dow Jones Transports. Currently, the TRAN is attempting to break above its recently-declining 20 day EMA. If the group can hold this important short-term technical moving average, it would bode well for the overall market. If it doesn't, then another element of risk needs to be evaluated:
 The red arrows highlight key resistance over the past several months, while the green arrows highlight support. One bullish signal was the TRAN climbing and clearing price resistance at 10000, which was established by the double bottom price support in March being lost. A second bullish signal could be developing now as the TRAN has closed above its 20 day EMA for two of the last three trading sessions. A big move lower and failure to hold 20 day EMA support would turn the tide back in favor of the bears. But a rally from here would help the market's bullish case.
Sector/Industry Watch
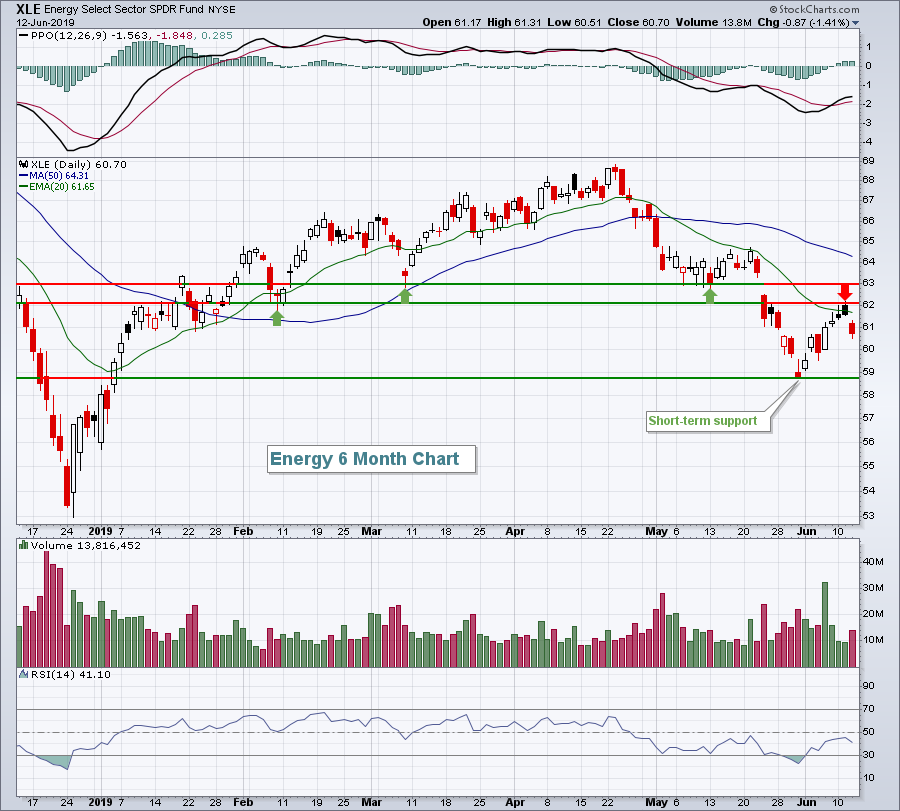
Crude oil prices ($WTIC, -4.00%) tumbled to close at $51.14 per barrel yesterday, encouraging another selloff in energy stocks. That was the lowest close on crude oil since the second week of January. In addition to fears of a global economic recession (which I do not agree with), oversupply is contributing to weak prices. Technically, the XLE fell exactly where I would have expected - at the 20 day EMA test and price resistance:
 This weakness in energy is occurring with a declining U.S. Dollar Index ($USD). Normally, a falling dollar will help to lift crude oil and energy shares. Not this time. I'd continue to avoid the group.
Historical Tendencies
I know many subscribe to the theory of "Go Away in May", but I think a better slogan would be "It's Time to Fly in Mid-July". By "Fly", I mean fly AWAY. On the S&P 500 since 1950, the July 17th close to the September 26th close has produced annualized returns of -2.16%. This period represents nearly 3400 trading days, or more than 13 years. Imagine trading a stock market that loses 2.16% every year for 13 years. That's what this upcoming period has done.
Key Earnings Reports
(reports after close, estimate provided):
AVGO: 5.17
Key Economic Reports
Initial jobless claims released at 8:30am EST: 222,000 (actual) vs. 216,000 (estimate)
Happy trading!
Tom
