Market Recap for Monday, April 15, 2019
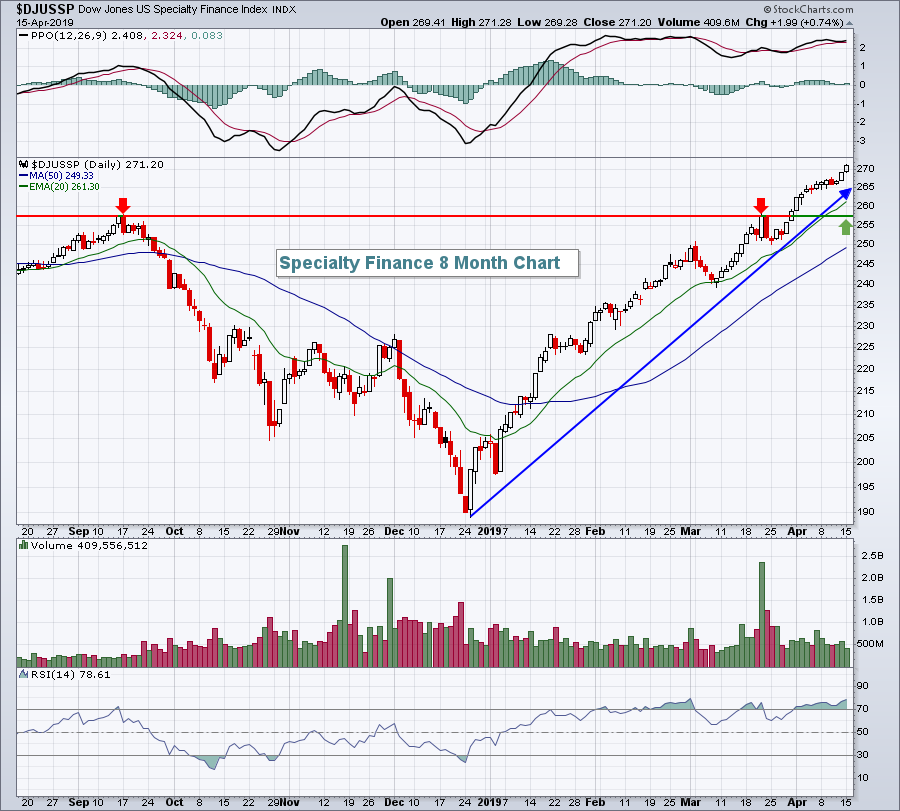
Defensive groups took their turn leading the stock market, but on a down day that is generally to be expected. Consumer staples (XLP, +0.59%) and healthcare (XLV, +0.40%) were the two leading groups, while financials (XLF, -0.63%) backed off from its Friday strength. More banks ($DJUSBK, -0.90%) reported their quarterly results, but market participants were unable to gather enough bullish momentum to take the DJUSBK higher to clear overhead price hurdles. Perhaps more encouraging earnings reports from this industry this morning will provide that impetus. Specialty finance ($DJUSSP, +0.74%) easily led financials once again, however, and remain one of the hottest industry groups heading into earnings season:
 A lot of money is rotating into this group, so look for stellar quarterly results in several names in the group, including recent outperformers like MSCI, Inc. (MSCI) and Moody's Corp (MCO).
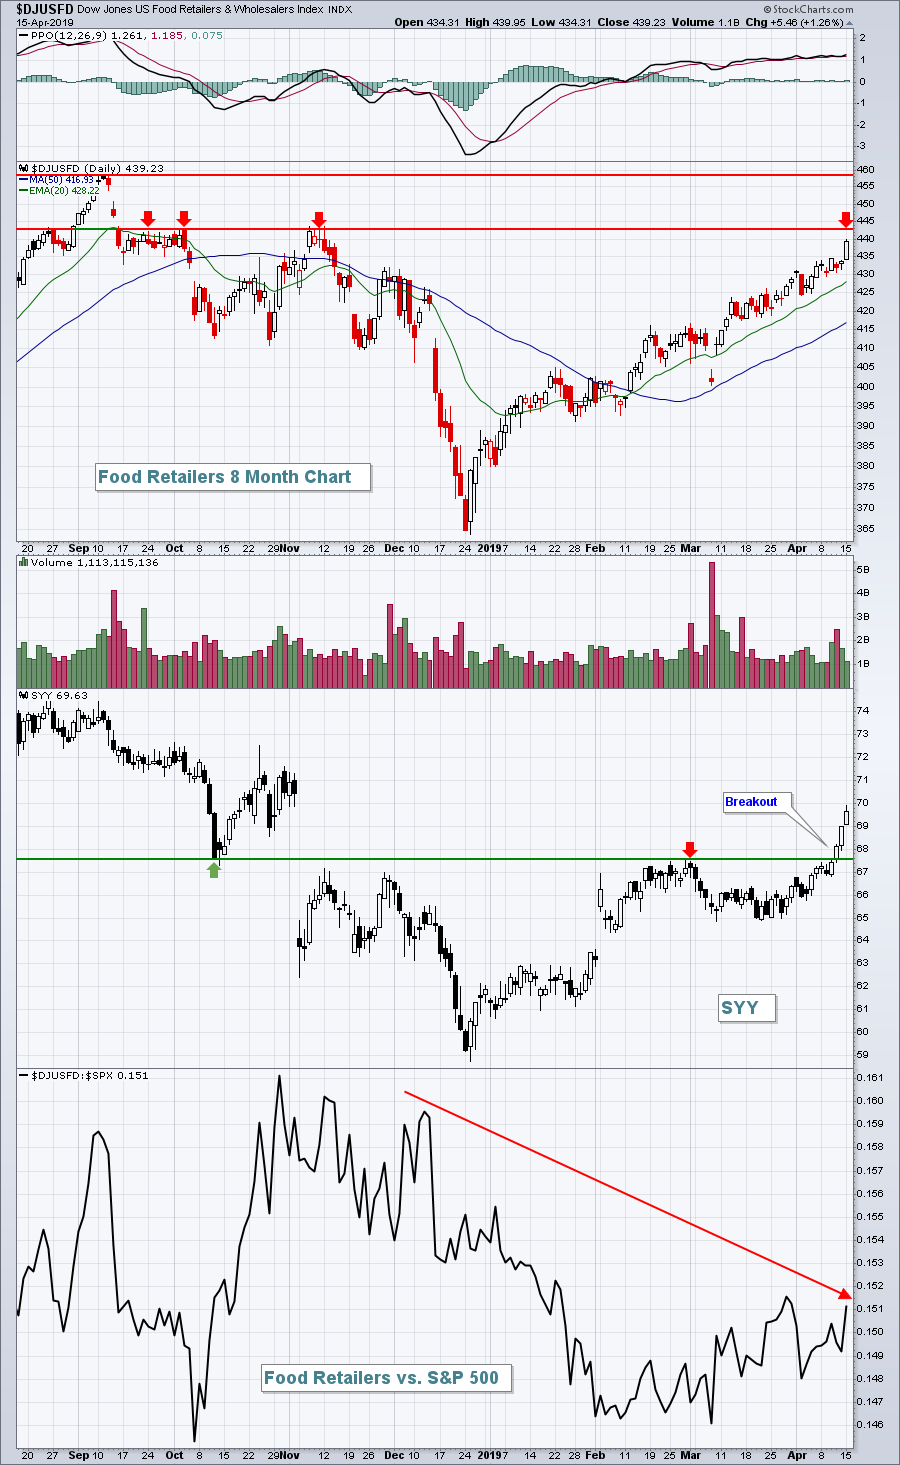
Food retailers ($DJUSFD, +1.26%) were the top performing group within consumer staples on Monday, led by a continuing advance in Sysco Corp (SYY):
 The DJUSFD has outperformed the benchmark S&P 500 over the past couple months, but it's difficult to do so as part of consumer staples and the overall relative downtrend since November is obvious. There's also key overhead price resistance approaching on the DJUSFD relative chart. SYY has been rallying, but it too has overhead gap resistance approaching. The group is definitely on the improve, but obstacles remain. Other aggressive areas of the market look much stronger technically to me.
Pre-Market Action
U.S. stocks are advancing in pre-market action with Dow Jones futures up more than 150 points currently. The 10 year treasury yield is up 3 basis points to 2.58% in its first bullish breakout (above 2.55% - January low). Rotation away from treasuries sends yields higher and many times provides a huge lift to equities.
Asian markets were up overnight and European markets are also having a solid morning, providing a bullish backdrop for U.S. equities.
Current Outlook
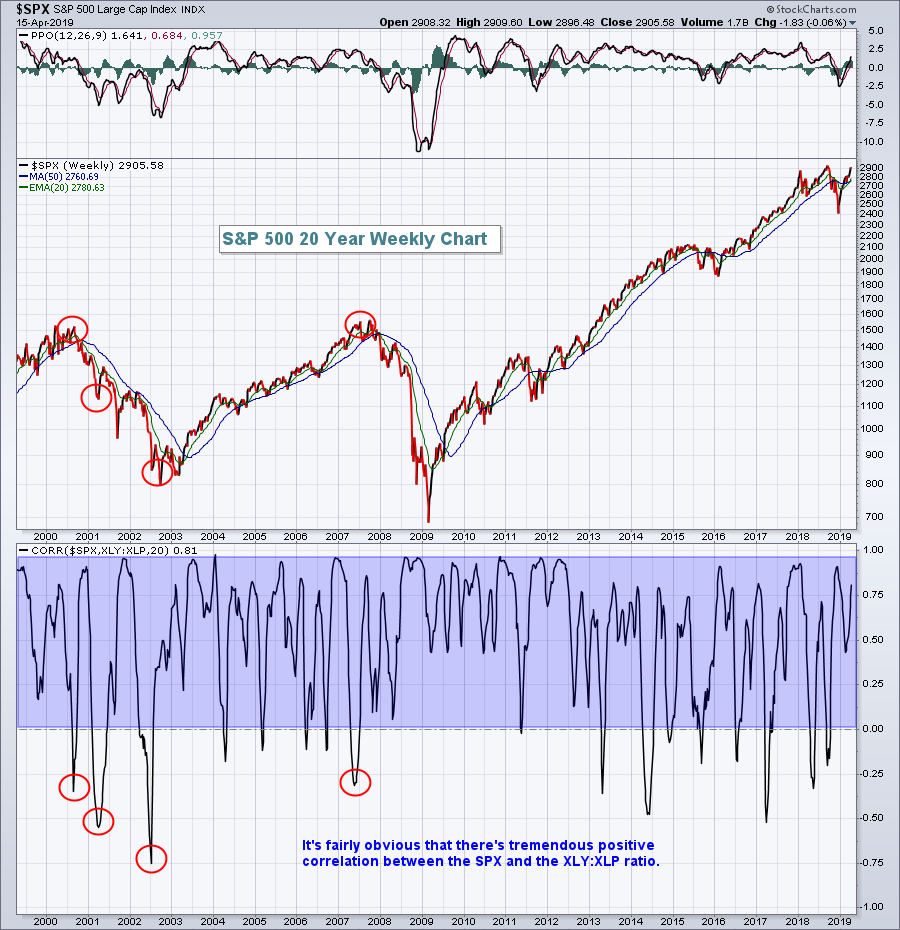
I believe one of the most important intermarket relationships exists in the consumer space. The relative strength of the more aggressive consumer discretionary stocks (sell things we want) vs. the more defensive consumer staples stocks (sell things we need) helps to provide clues as to overall market direction, in my opinion. As the S&P 500 trends in one direction or the other, the XLY:XLP generally trends in the same direction. To illustrate this point, check out the following S&P 500 chart, along with the correlation coefficient below it:
 That's not a 6 month chart. It's 20 years! We have barely seen any negative readings, meaning that the S&P 500 and the XLY:XLP ratio tend to trend in the same direction - very important to know. While negative correlations in recent years haven't necessarily produced major reversals, they did from 2000 to 2007. Perhaps a negative correlation in a secular bear market produces a more important signal than a similar correlation reading in a secular bull market?
The consumer discretionary sector includes areas that should perform well in an improving economic environment, while the consumer staples sector isn't as dependent on a strong economy. Do you only brush your teeth when employment is strong?
Sector/Industry Watch
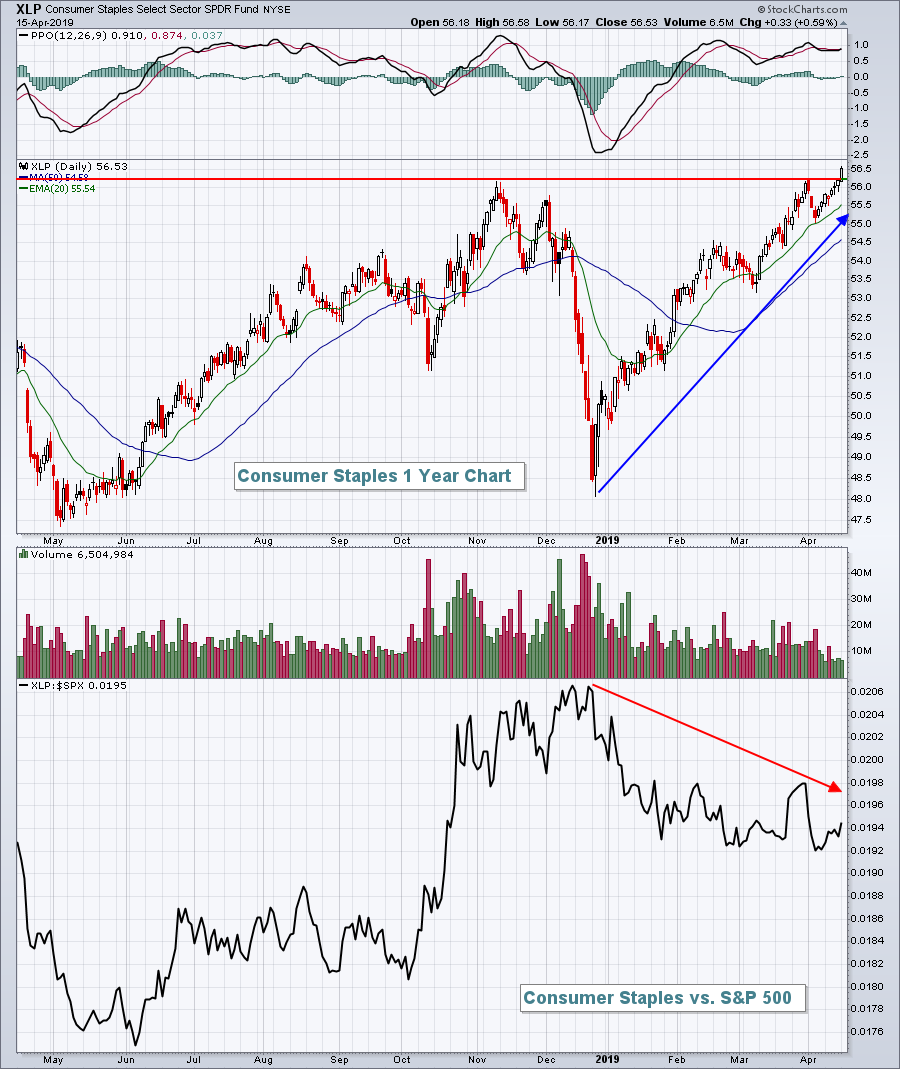
Consumer staples (XLP, +0.59%) rallied to lead all sectors on Monday. It wasn't just any other day, however, as the XLP closed at an all-time high. It's always a good sign to see areas of the stock market posting new highs and consumer staples have now joined that crowd:
 Many believe that defensive groups breaking out to new highs is a sign of weakness. That's not true. We want to see wide participation and all equities rallying. A potential warning sign would be relative strength in defensive sectors during a major stock market advance. While the XLP has enjoyed considerable absolute strength since the December low, it's actually been outperformed by the more aggressive sectors and that adds to the bullishness of the current rally.
Historical Tendencies
The next three days have been historically bullish for the small cap Russell 2000 index. Here are the annualized returns for these three days since 1987:
April 16: +142.86%
April 17: +57.04%
April 18: +132.61%
Key Earnings Reports
(actual vs. estimate):
BAC: .70 vs .65
BLK: 6.61 vs 6.20
CMA: 2.08 vs 1.94
JNJ: 2.10 vs 2.03
OMC: 1.17 vs 1.08
PGR: 1.83 vs 1.38
PLD: .73 vs .72
UNH: 3.73 vs 3.60
WIT: .07 - estimate, awaiting results
(reports after close, estimate provided):
CSX: .91
IBKR: .43
IBM: 2.21
MLNX: 1.45
NFLX: .57
UAL: .94
Key Economic Reports
March industrial production to be released at 9:15am EST: +0.3% (estimate)
March capacity utilization to be released at 9:15am EST: 79.1% (estimate)
April housing market index to be released at 10:00am EST: 63 (estimate)
Happy trading!
Tom
