Market Recap for Tuesday, March 26, 2019
Strength in global markets seemed to influence the U.S. market at the open as equities surged higher. But sellers dominated most of the balance of the day as gains evaporated. A final 30 minute surge just before the close restored some of the earlier gains and all of our major indices finished in positive territory, led by the Russell 2000's 1.01% climb. All 11 sectors managed to end the gains with gains as well. Energy (XLE, +1.44%) and the beaten-down financials (XLF, +1.19%) led on a relative basis. Banks ($DJUSBK, +1.59%), which have dropped more than 6% over the past month as treasury yields have plummeted, found some value investors.
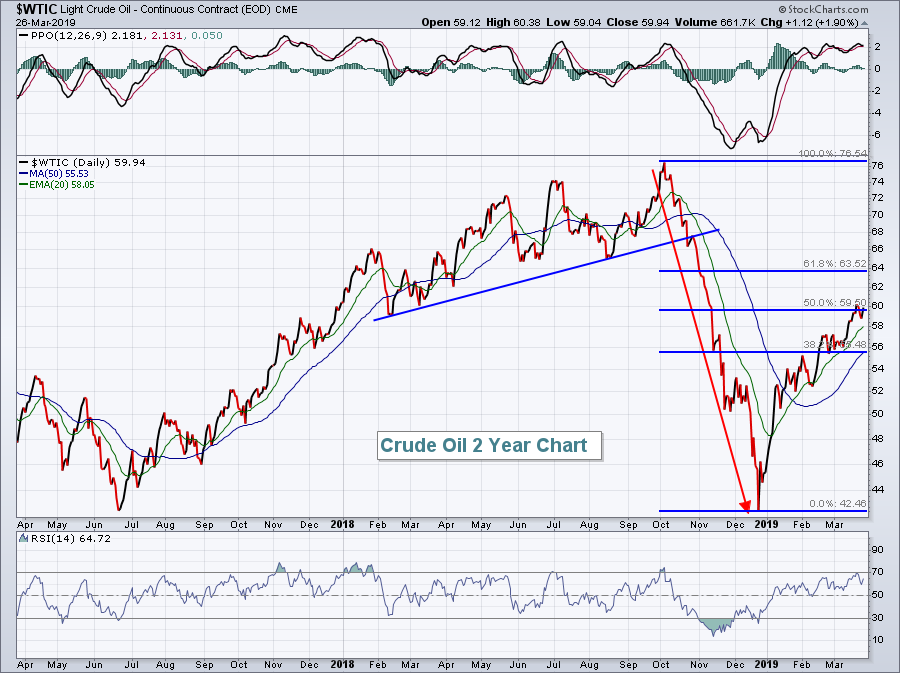
Energy was a favored sector as crude oil prices ($WTIC, +1.90%) remain on a steady course of higher prices. We've reached a key Fibonacci retracement level, however, so we'll have to see how prices react from here:
 There's also an argument building as to whether prices are rising due to expected improvement in demand later in 2019 or if it's simply a case of oversupply. My guess would be the latter, especially given some of the global stock market weakness.
One day after leading U.S. stocks, the consumer discretionary sector (XLY, +0.43%) was the worst performer. Most areas within discretionary were higher, but recreational services ($DJUSRQ, -2.91%) struggled after a disappointing quarterly earnings report from Carnival Corp (CCL, -8.72%). CCL was the worst performer on the S&P 500.
Pre-Market Action
The 10 year treasury yield ($TNX) has dipped beneath 2.40%, but that still has not spooked equity investors as U.S. futures are higher this morning. Dow Jones futures are currently higher by 17 points with a half hour before the opening bell.
Asian markets were mixed overnight and we're seeing fractionally higher prices in Europe mostly.
Current Outlook
There are several different ways to use StockCharts.com to evaluate the domestic economy. One way is to plot the monthly jobs report on a SharpChart. The symbol is "$$EMPLOY". As long as that "price" rises, it's generally a good signal about our economy. A falling price would indicate contraction in the jobs market, which is usually followed by a recession.
But there are other ways to gather information about our economic picture. The railroads ($DJUSRR) can provide us clues as that group only ships in North America. If the stock market prices in what it sees 6-9 months in advance and the DJUSRR is falling and technically broken, it adds a warning signal regarding the U.S. economy. It wouldn't necessarily suggest a recession, just that the economic picture might be weakening.
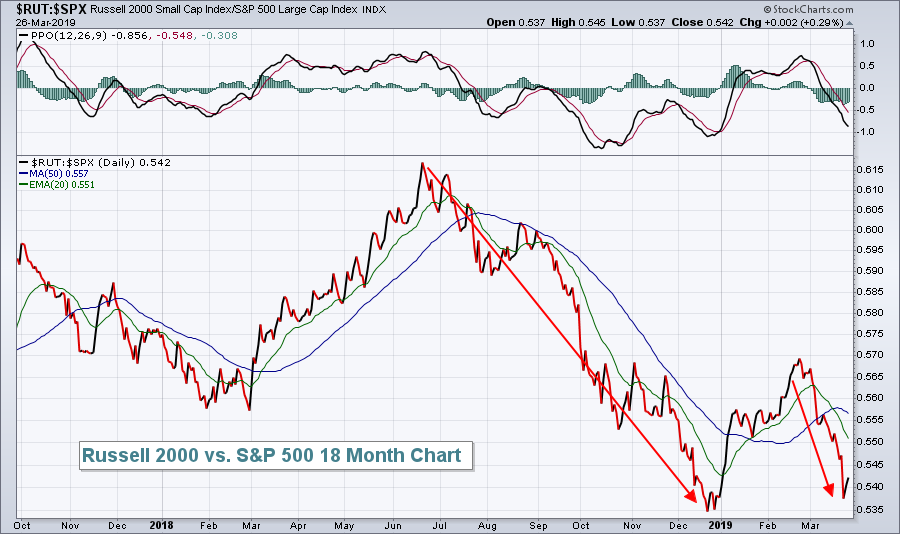
I think it can be important to see how the small cap Russell 2000 is performing vs. the benchmark S&P 500. The Russell 2000 is comprised of companies that do all or nearly all of their business in the U.S. The S&P 500, on the other hand, represents multinational companies much more affected by global economic conditions. Outperformance by the Russell 2000 could indicate a much stronger U.S. economy ahead. Having said that, I'm a little perplexed by the rapidly declining 10 year treasury yield ($TNX) and the similar performance of small caps relative to the S&P 500 ($RUT:$SPX):
 There is consistency among many of my signals that the U.S. economy is either slowing or is not going to be as strong as previously expected. The Fed appears to agree as it's backed off its rate-hiking campaign. But then that begs the question, "why have U.S. equities performed so well the past three months"?
One possible answer is that old Wall Street adage, "Don't Fight The Fed". The Fed has turned dovish, as have central banks around the globe. It could be that traders are simply looking past the rough patch in 2019 and focusing instead on the likelihood of improving economic strength beyond.
Sector/Industry Watch
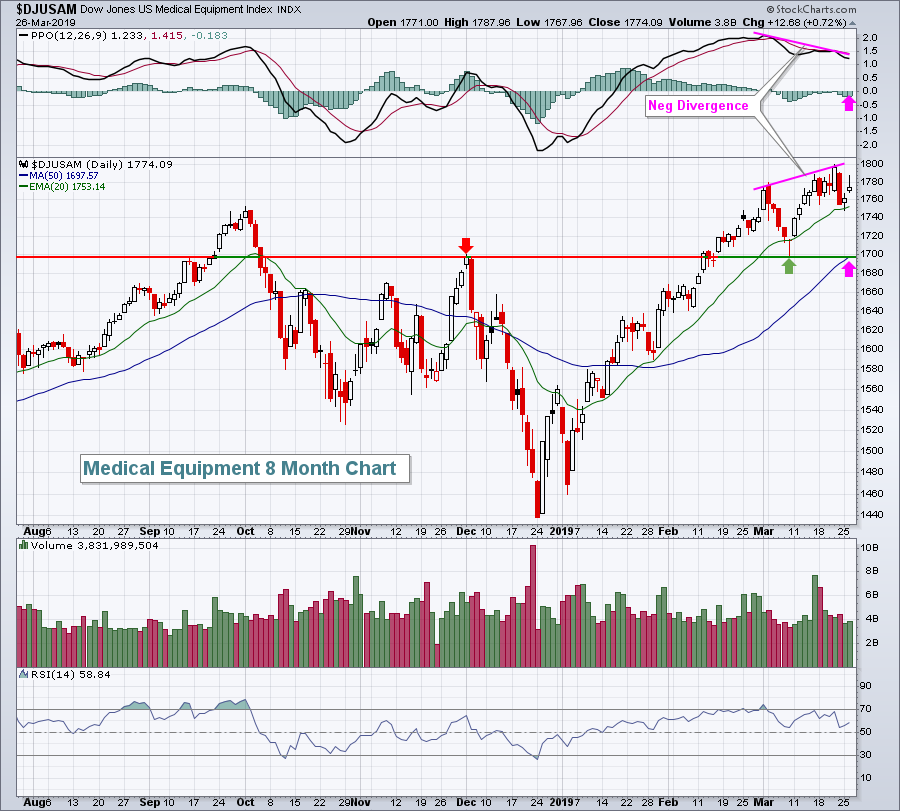
Medical equipment stocks ($DJUSAM, +0.72%) continue to perform well, despite an overall healthcare group that's been lagging. There's one problem, however. The DJUSAM has printed a negative divergence that could result in further consolidation or selling:
 I look for PPO centerline tests and/or 50 day SMA tests (pink arrows) after negative divergences print. Note that a 50 day SMA test here would also coincide with a fairly significant price support level. If and when the DJUSAM breaks out, one component stock that looks solid technically is Intuitive Surgical (ISRG). In the Historical Tendencies section below, ISRG is featured as one of the top seasonal performers in the S&P 500 in Q2 over the last two decades. It's worth considering if we see a breakout in the group.
Historical Tendencies
I did research to find S&P 500 companies that meet all of the following historical criteria for the period April through June (Q2) over the past two decades:
(1) They average positive returns for each of the 3 months
(2) They total average gains of at least 15% for the 3 months combined
(3) Their cumulative Q2 gains represent at least 40% of their average annual gain
The companies meeting these criteria are reflected below, along with their average Q2 gains over the past 20 years:
VRTX: +21.2%
SBAC: +16.6%
ALGN: +15.8%
ISRG: +15.2%
Key Earnings Reports
(actual vs. estimate):
LEN: .74 vs .75
PAYX: .89 vs .89
(reports after close, estimate provided):
FIVE: 1.57
LULU: 1.74
PVH: 1.75
SNX: 2.75
VRNT: 1.01
Key Economic Reports
None
Happy trading!
Tom
