Market Recap for Tuesday, January 29, 2019
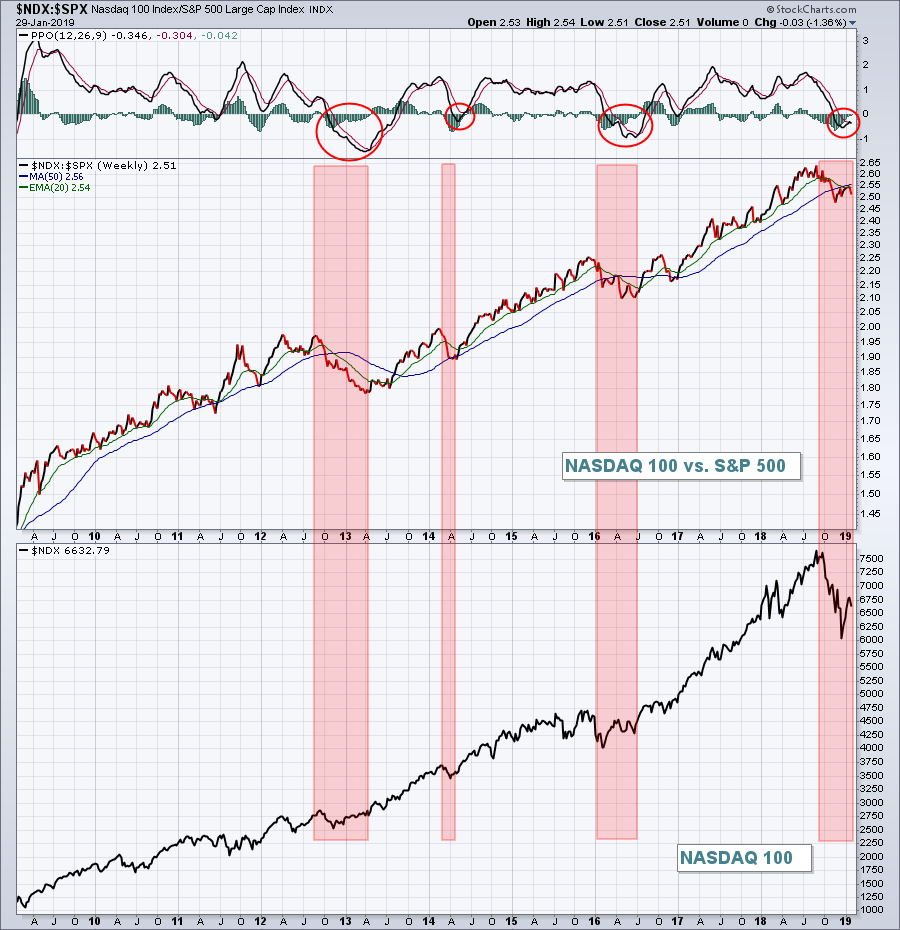
It was a bifurcated and trying day on Wall Street. Bifurcation isn't necessarily a bad thing as some indices will simply outperform others on certain days and short-term trends in that regard can mostly be ignored. But one problem throughout this cyclical bear market is that the more aggressive NASDAQ 100 ($NDX) has been lagging the benchmark S&P 500 and it's been rather consistent. Generally, when the NDX lags, the overall market is not performing very well. Here's a look at the past decade:
 Over the past decade, there have only been four times when the weekly PPO of the NDX:SPX ratio has dropped below the centerline (red circles). The red shaded areas highlight the absolute and relative performance of the NASDAQ 100 during these periods. When the PPO is negative and the ratio is beneath its 20 week EMA, the best that the NDX does is consolidate. One worry I have is that this very influential index (NDX) is turning back down vs. the benchmark S&P 500 and is currently below the 20 week EMA. This relationship needs to change for the next bull market to emerge.
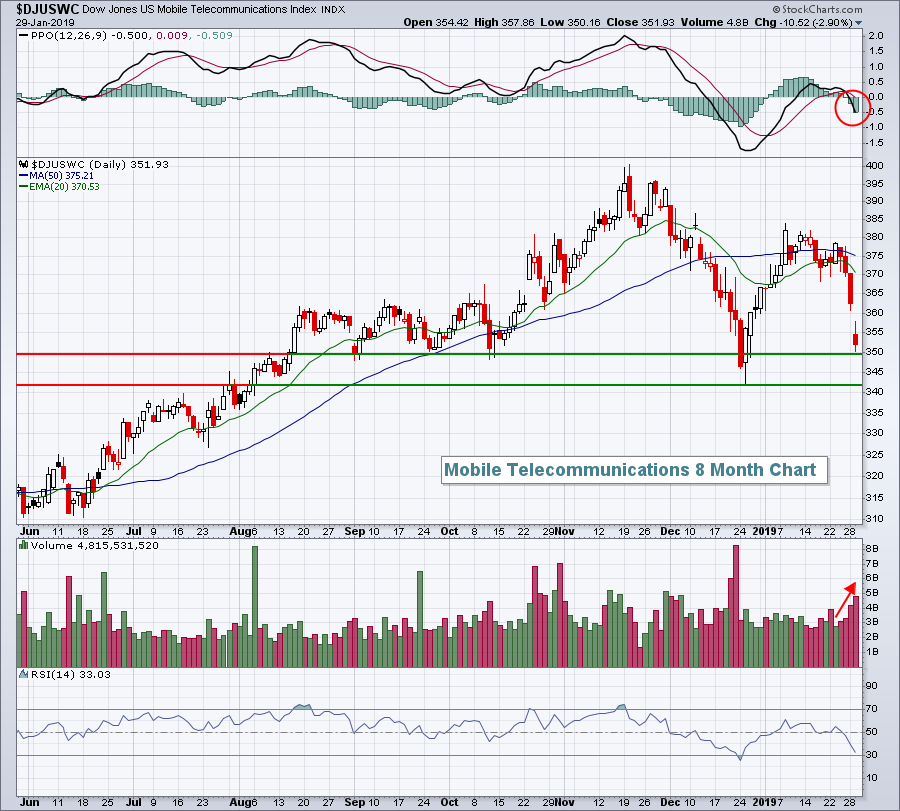
In Tuesday's action, the Dow Jones gained 0.21%, but was the only major index to finish in positive territory. The S&P 500, NASDAQ and Russell 2000 dropped 0.15%, 0.81% and 0.14%, respectively, as four key aggresive sectors faltered. Communication services (XLC, -1.18%), technology (-1.08%), consumer discretionary (XLY, -0.65%) and financials (XLF, -0.35%) all had difficulty holding onto recent gains. Mobile telecommunications ($DJUSWC, -2.90%) continued their recent rapid descent and is closing in on its December low:
 Volume has been accelerating on the recent selling and we've seen the daily PPO move back into negative territory, two bearish developments.
A big problem on Tuesday was the weak performance by the FAANG stocks - Facebook (FB, -2.22%), Apple (AAPL, -1.04%), Amazon.com (AMZN, -2.69%), Netflix (NFLX, -2.01%) and Alphabet (GOOGL, -0.91%). These are very large cap stocks that have an extremely heavy influence on our major indices. Without their participation, the recent rally is likely doomed. Apple's earnings report last night seemed to soothe some fears, so let's see how these five FAANG stocks react today.
Pre-Market Action
Traders are reacting positively to a couple of key earnings reports from last night and this morning, namely Apple, Inc. (AAPL, +4.65%) and Boeing (BA, +5.89%). There have been plenty of mixed earnings reports thus far, but traders buying into these two giants this morning can only help our major indices.
Despite a strong ADP employment report, the 10 year treasury yield has barely budged, up 1 basis point to 2.72% this morning. Dow Jones futures are currently higher by 220 points as we approach today's opening bell.
Current Outlook
There remain so many mixed signals that it's very difficult to say whether the uptrend since the December 26th low is here to stay or not. History tells me that "V" bottoms are rare. The last two cyclical bear markets within a secular bull market - 1998 and 1990 - both saw, minimally, a retest of the initial low. But every market is different and there are no certainties that we'll follow the historical path. I'm open to either a retest or a continuing move higher because I believe we're in a secular bull market. Therefore, my longer-term view is going to be skewed to the bullish side. Short-term, I'd like to see the retest. Time will tell.
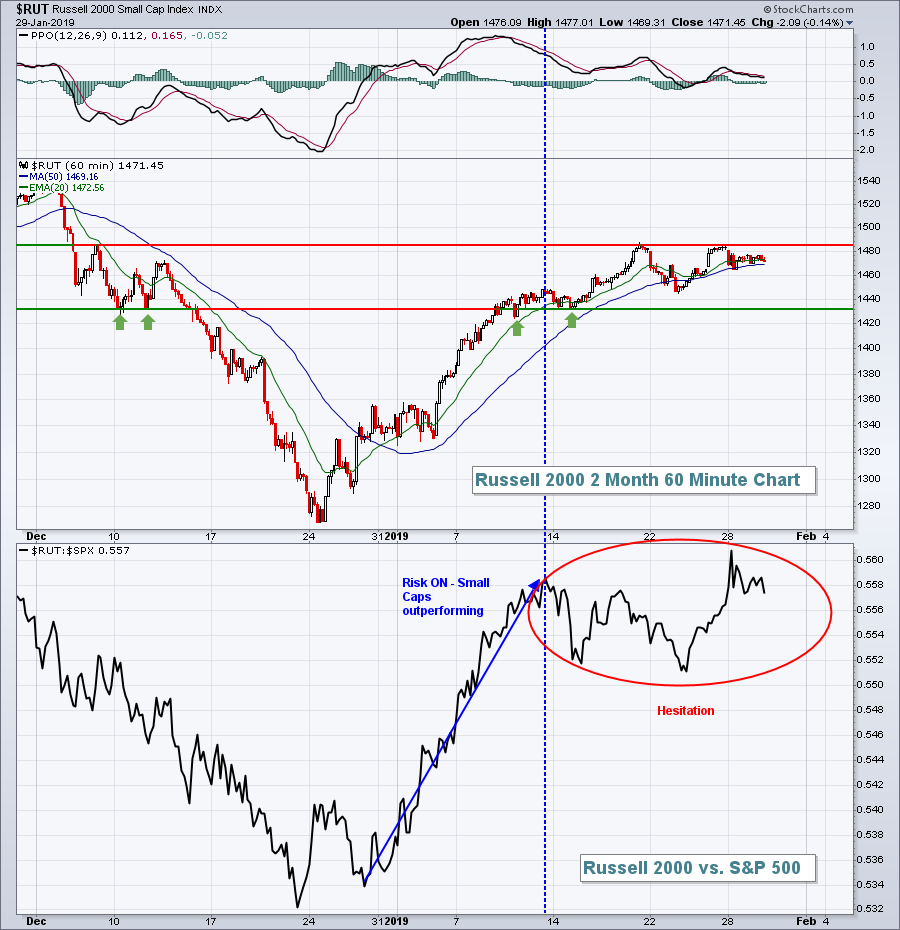
One positive sign has been the resurgence of small caps, on both an absolute and relative basis. The following chart illustrates:
 I showed a similar chart 2-3 weeks ago in this blog. The "risk on" environment was quite clear when the Russell 2000 was wildly outperforming the S&P 500, but over the past couple weeks the small caps have simply been going along for the ride with the benchmark S&P 500 - and that's not a bad thing. I would watch the two price levels shown on the Russell 2000 chart, resistance near 1485 and support close to 1430. There's nothing more important that actual price action in my view. So a breakout or breakdown from this range would provide further evidence as to whether we should be expecting a retest of the December low.
Sector/Industry Watch
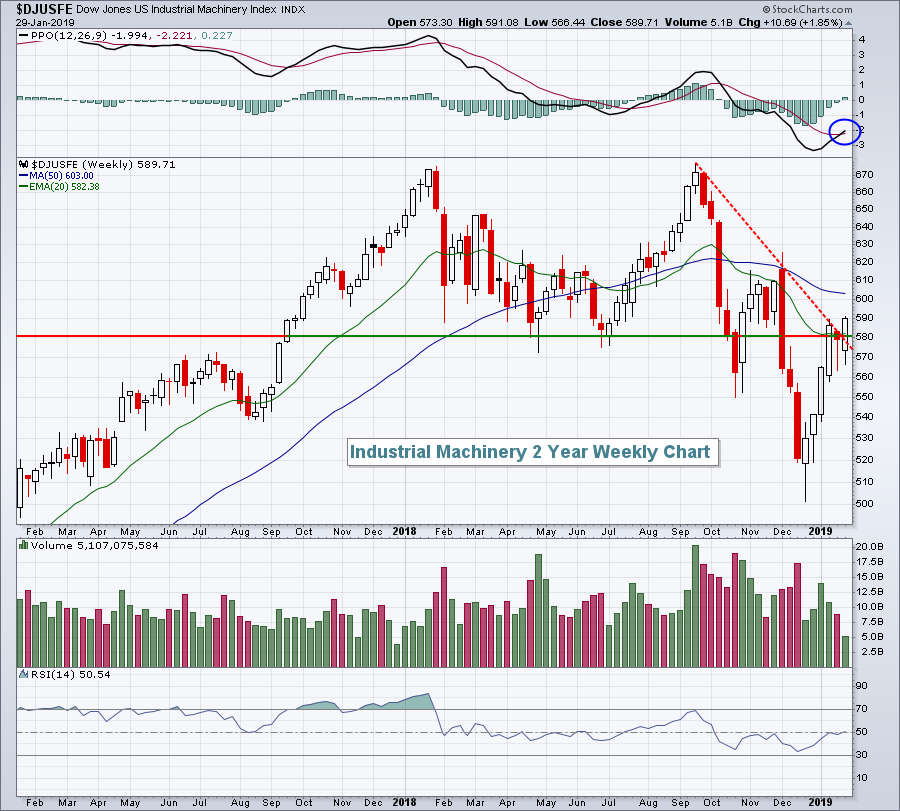
Industrial machinery ($DJUSFE) surged nearly 3% on Tuesday and cleared recent closing highs to establish its highest close since the first trading day in December. It'll still take some work for the DJUSFE to clear that early December high, but bulls should be taking steps one at a time. While the daily chart certainly has seen improvement, the weekly chart is also strengthening:
 We have to recognize that this week's candle is nowhere near complete. It's not complete until Friday's close. We could be witnessing a bearish false breakout. But the flip side is that this breakout is for real and that would be extremely bullish.
Historical Tendencies
Thursday and Friday are January 31st and February 1st, respectively, and those two calendar days have produced annualized returns of +80.57% and 90.35%, respectively, since 1971 on the NASDAQ.
Key Earnings Reports
(actual vs. estimate):
ADP: 1.34 vs 1.18
ANTM: 2.44 vs 2.20
BA: 5.48 vs 4.52
BABA: 1.77 vs 1.63
GD: 3.07 vs 2.98
IR: 1.32 vs 1.28
MCD: 1.97 vs 1.90
NVS: 1.24 vs 1.33
RCL: 1.53 vs 1.51
SIRI: .06 vs .06
T: .86 vs .85
TMO: 3.25 vs 3.19
(reports after close, estimate provided):
FB: 2.17
MDLZ: .63
MSFT: 1.09
NOW: .64
PYPL: .67
QCOM: 1.08
TSLA: 2.08
V: 1.25
Key Economic Reports
January ADP employment report released at 8:15am EST: 213,000 (actual) vs. 174,000 (estimate)
Q4 GDP released at 8:30am EST: 2.6% (estimate - actual number is delayed due to recent govt. shutdown
December pending home sales to be released at 10:00am EST: +0.3% (estimate)
FOMC policy statement to be released at 2:00pm EST
Happy trading!
Tom
