Market Recap for Thursday, December 20, 2018
If you haven't noticed, I use a lot of weather analogies in describing the stock market. It's by design as forecasting the stock market has a lot of similarities to forecasting the weather. Meteorologists are often scrutinized as weather patterns can change quickly. They have to change their forecasts on the fly to keep up with all the current happenings. Welcome to the world of stock market forecasting where technical analysts essentially do the same thing.
Bear market 2018 (or Hurricane Jerome) made landfall at Broad and Wall (Streets) this week with high winds (VIX) with initial devastation in the billions of dollars. We could be in for further heavy damage for another day or two as the eye wall approaches. Then we'll see a period of calm before the backside of the hurricane comes through. That "wall" will be fun for the longs and provide some temporary relief. Unfortunately it won't last. More on the outlook in the Current Outlook section below. So what happened yesterday?
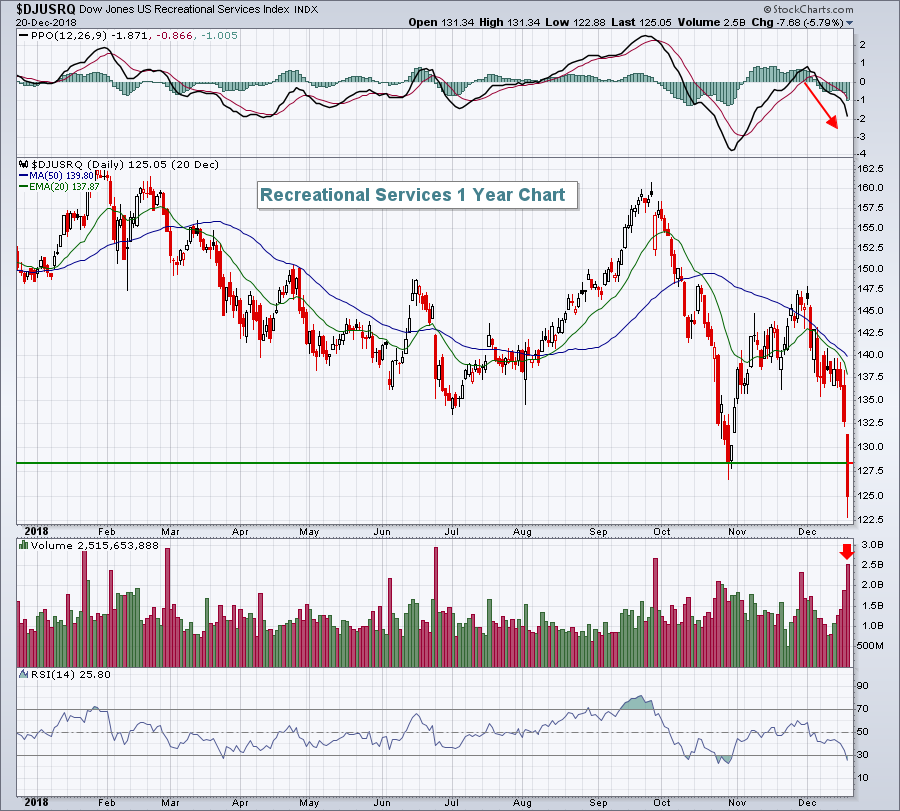
It was another buyers' strike as all of our major indices tumbled. The Dow Jones, S&P 500, NASDAQ and Russell 2000 fell 1.99%, 1.58%, 1.63% and 1.72%, respectively. Damage was found across most sectors as only utilities (XLU, -0.06%) was spared. Energy (XLE, -2.77%) and consumer discretionary (XLY, -2.24%) were hardest hit. The former was hurt by the further decline in crude oil prices ($WTIC), discussed further in the Sector/Industry Watch section below. The XLY, on the other hand, was hurt by most of its industry groups, but primarily by recreational services ($DJUSRQ, -5.79%) and restaurants & bars ($DJUSRU, -3.00%). The DJUSRQ broke below prior support on very heavy volume:
 The DJUSRQ is oversold and will likely bounce soon, but the more intermediate-term trend is lower.
Pre-Market Action
Well, I'm running a late with today's blog article, so the pre-market has already passed me by. But as I publish this article, the Dow Jones is up 117 points. Let's see if it lasts.
Asia was mostly lower overnight and Europe is fractionally lower this morning.
Nike (NKE) reported very strong quarterly results last night and is being rewarded this morning, currently up more than 8%.
Current Outlook
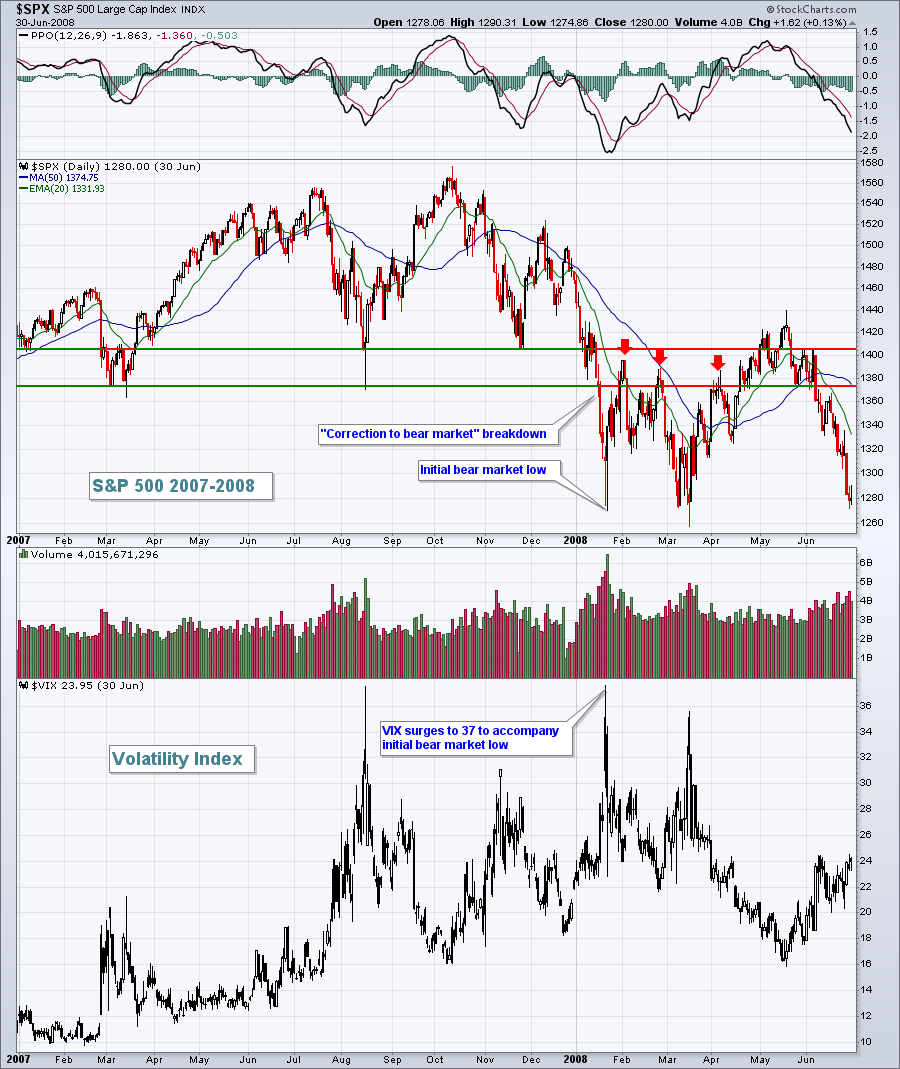
We now must remember one thing. The game has changed. I'm no longer looking at support holding and resistance being broken. That's the expectation in a bull market. Now we're in a bear market where support levels typically break and resistance levels become walls of steel. Look at charts and think "lower highs and lower lows". Still, we're becoming incredibly oversold and fear is spiraling out of control. We're getting close to an initial bear market low. There will be new lows down the road, but a key initial low is being established with capitulation right around the corner. Some might argue we just saw it, but my guess is that we need a bit more panic to truly set our first bear market bottom. Let's look at the last bear market and its initial drop beneath key price support that transitioned that "correction" to "bear market":
 First, let me say that every bear market is different. Second, we don't even know for sure that this is a bear market, but the key ingredients are certainly there. Third, note the VIX high of 37 to mark the initial downthrust of the bear market. Extreme levels of fear (high VIX readings) should be used to help identify short- to intermediate-term bottoms. Finally, note that the red arrows mark important reaction highs that developed in prior support zones. That area becomes key resistance on bear market rallies. Using the last bear market as a guide, let's "project" what we might see as we close out 2018 and head into 2019:
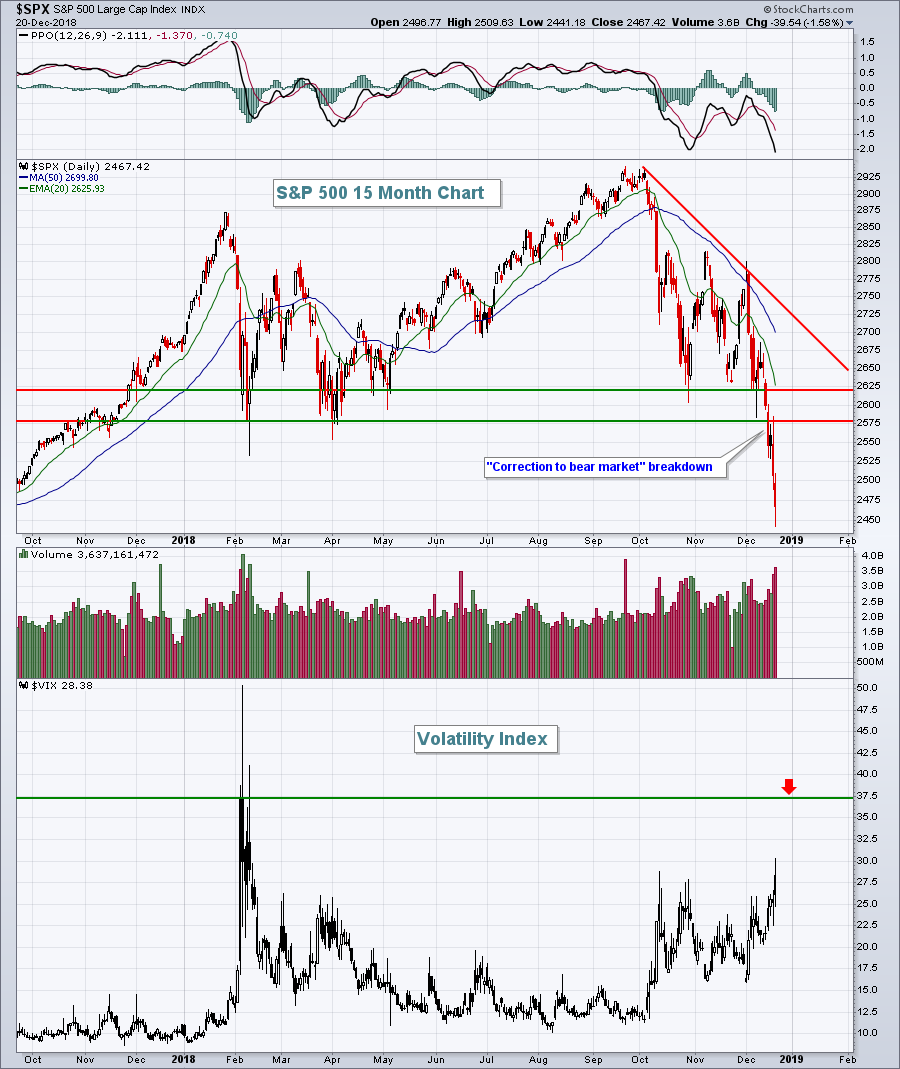
 Please understand that I'm using history to provide us a possible guide to what to look for. Again, there are no certainties here. Personally, I'd like to see more selling with the VIX exploding higher into the mid-30s, then reversing in the final 2-3 hours one day. That would likely accompany a bloodbath on the S&P 500 as we drop into the 2300s. An afternoon reversal could then set the stage for a nice rally, perhaps the best we'll see during the bear market. A 10%-12% rally back to a resistance zone between 2580 (the point of the breakdown from correction to bear market) and 2620 (earlier price support) is a definite possibility. If I have any longs, that'll be the point I exit them and look for shorting opportunities.
Also, keep one eye on the 20 week EMA, currently at 2718, as it will drop quickly. As that falls, it too will provide key resistance on the longer-term weekly chart. 2019 is setting up to be a very difficult year, but we'll take it day-to-day until we get to the other side.
Sector/Industry Watch
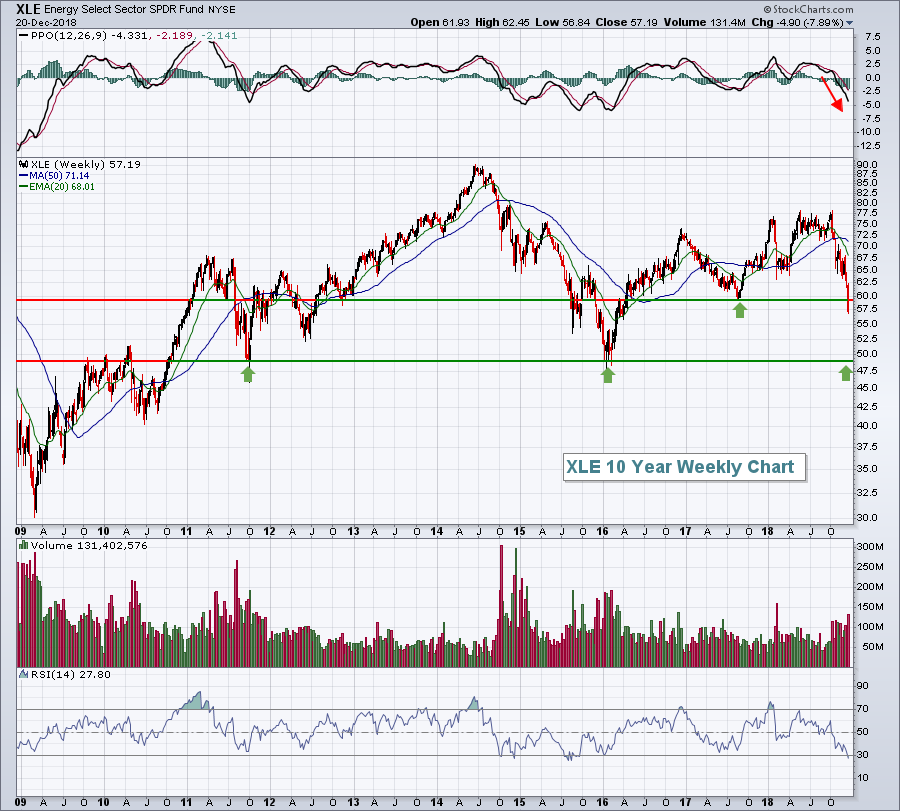
Energy (XLE, -2.77%) was the worst performing sector on Thursday as crude oil ($WTIC, -4.75%) continued tumbling. The losing streak has been remarkable and crude oil is down again this morning to $45.23 per barrel (-1.42%). Rapidly-declining crude oil prices will make energy's recovery a difficult one. In fact, from a technical perspective, the XLE appears headed to 50 or possibly a bit lower:
 2017 price support near 60 was lost this week, so that now sets up next key price support just below 50. There's no guarantee we reach that level, but based on all the evidence at this time, it certainly appears we're headed there.
Historical Tendencies
It's been a very rough December for all U.S. equities, especially small caps. This goes against historical tendencies as small caps typically perform best in December. The Russell 2000's annualized performance breakdown in December since 1987 is as follows:
December 1-19: +9.48%
December 20-31: +79.24%
Furthermore, check out the Russell 2000's annualized returns by day for the balance of December:
December 21: +154.22%
December 22: +70.06%
December 23: +103.86%
December 24: +47.67%
December 25: (market closed)
December 26: +119.37%
December 27: +24.86%
December 28: +20.12%
December 29: +64.39%
December 30: +87.88%
December 31: +104.23%
Watch for a reversing candle as the Volatility Index ($VIX) is at its highest level since the February low. Once a significant short-term low is established, I believe a bear market rally will follow, supported by historical tailwinds.
Key Earnings Reports
(actual vs. estimate):
KMX: 1.09 vs 1.01
Key Economic Reports
November durable goods released at 8:30am EST: +0.8% (actual) vs. +1.4% (estimate)
November durable goods ex-transports released at 8:30am EST: -0.3% (actual) vs. +0.3% (estimate)
Q3 GDP - final estimate - released at 8:30am EST: 3.4% (actual) vs. 3.5% (estimate)
November personal income to be released at 10:00am EST: +0.3% (estimate)
November personal spending to be released at 10:00am EST: +0.3% (estimate)
December consumer sentiment to be released at 10:00am EST: 97.5 (estimate)
Happy trading!
Tom
