Market Recap for Monday, December 17, 2018
Every component stock in the Dow Jones Industrial Average fell on Monday as the index dropped another 500 points. The S&P 500 lost major closing price support at 2581, crude oil ($WTIC) threatened to break below $50 per barrel, small caps ($RUT) and transports ($TRAN) extended their jaw-dropping December swoons, and railroads ($DJUSRR), a bull market leader and proxy for our domestic economy, broke to closing lows not seen since early May.
In the words of the 1980s music group The Bangles, "it was just another Manic Monday". (See Historical Tendencies section below)
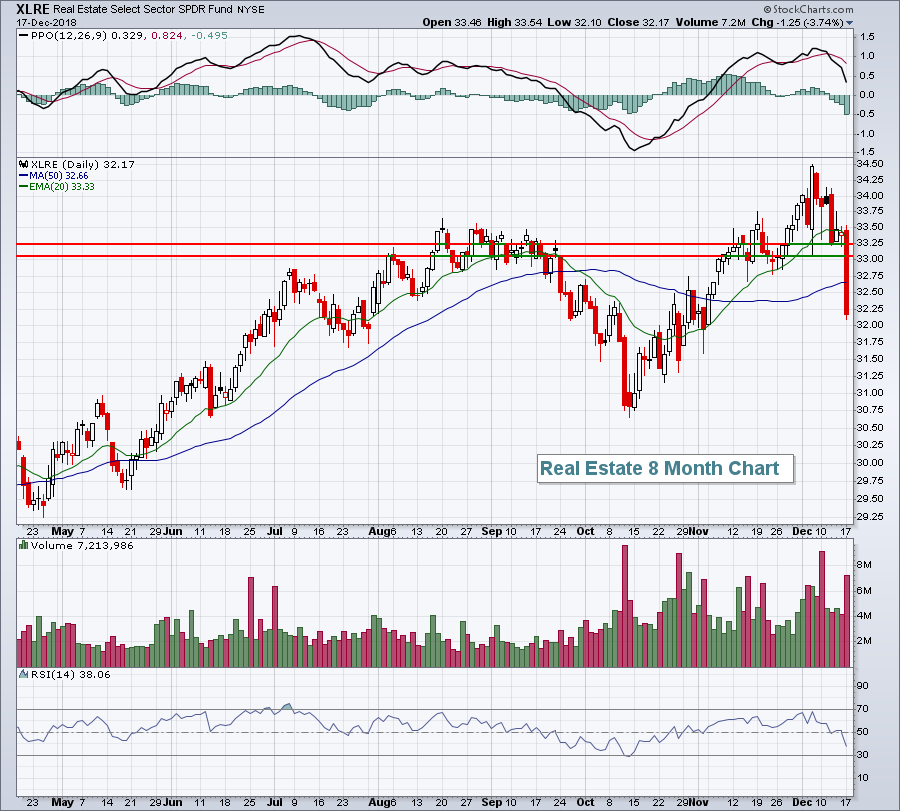
There was one very interesting development regarding the selling on Monday. It was across-the-board with all 11 sectors falling. However, the weakness was concentrated in defensive sectors as real estate (XLRE, -3.74%), utilities (XLU, -3.22%) and consumer staples (XLP, -2.31%) were among the top 4 losers on the sector leaderboard. That's very unusual. As the S&P 500 moves to lower closing lows, fear typically sends traders scurrying to get out of aggressive sectors and that was not the case on Monday. The bullish argument would be that aggressive stocks held up relatively well yesterday on a major S&P 500 breakdown. The bearish argument would be "that's a needle in a haystack, look at everything else". There are plenty of areas where we have technical sell signals and real estate (XLRE) just threw their name in the hat:
 That HUGE red-filled candle says it all. Two levels of short-term price support were lost, along with both key moving averages, the 20 day EMA and 50 day SMA. And volume was very heavy as well. The big problem that the market faces right now is that it's been estimated that 40% of Wall Street volume represents the action of technical traders. Currently, very few areas of the market are on technical buy signals. That's what will make recovery and continuation of the nearly 10 year bull market so difficult.
Pre-Market Action
Futures are pointing to a small bounce after both housing starts and building permits exceeded expectations. However, crude oil ($WTIC) remains under pressure, down another 1.34% to $49.21 per barrel at last check. It would represent crude oil's first close beneath $50 per barrel in over 14 months and is a sign of a slowing global economy.
Dow Jones futures are higher by 136 points as we approach the opening bell.
Current Outlook
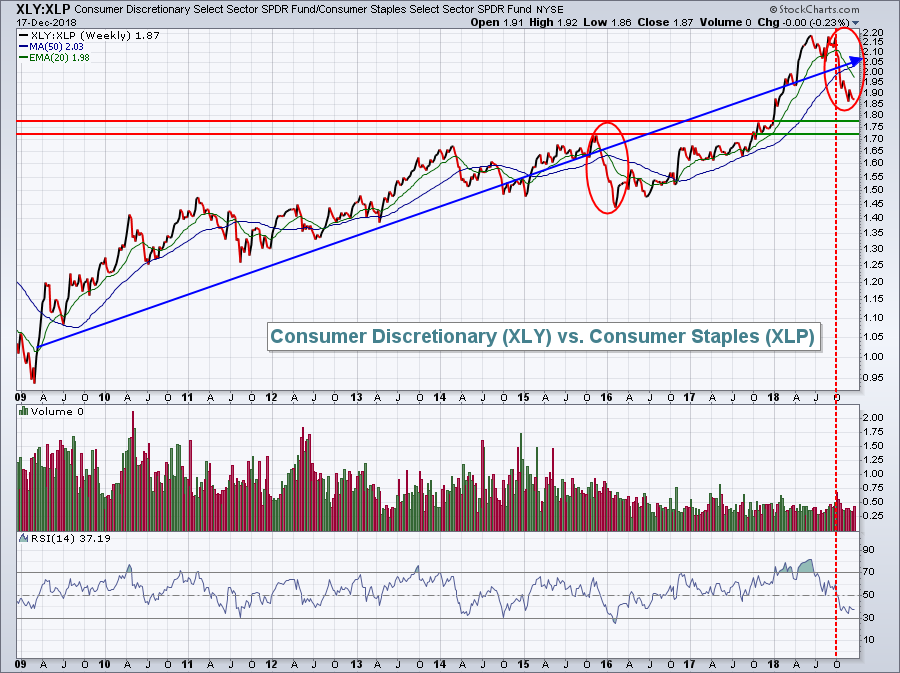
I'm constantly reviewing the relationship between consumer discretionary and consumer staples stocks. Consumer discretionary companies generally sell things that we WANT, whereas consumer staples companies sell things that we NEED. As bear markets approach, the ratio XLY:XLP tends to go into a death spiral downward as Wall Street firms rotate their holdings towards those more defensive-oriented staples stocks. In 2007, very early in the bear market, this XLY:XLP ratio declined to multi-year lows. It can be an excellent "under the surface" signal to warn of impending bearish stock market action. With that in mind, let's look at the current relationship:
 The ratio has generally moved higher throughout the bull market, as I would expect. But you can see the two periods highlighted where the relationship became "questionable". In early 2016, this ratio tumbled to a multi-year low back at a time when the S&P 500 was on the verge of a major breakdown. Price support held, however, and we soon saw this XLY:XLP ratio climbing to support the continuation of the bull market. Since October, this ratio has been tumbling along with many areas of the market. But it was very strong to begin October and showed no signs of wilting. If I looked at nothing else going on in the U.S. stock market except this ratio, I'd still be fairly positive, thinking the relative weakness since October is nothing more than a much-needed relative pullback. Fortunately, we know there are a number of issues taking place on Wall Street that are noteworthy. The XLY:XLP decline is not suggestive of a bear market, but does suggest that we should continue to monitor it closely for further deterioration, which would be indicative of an impending bear market.
Sector/Industry Watch
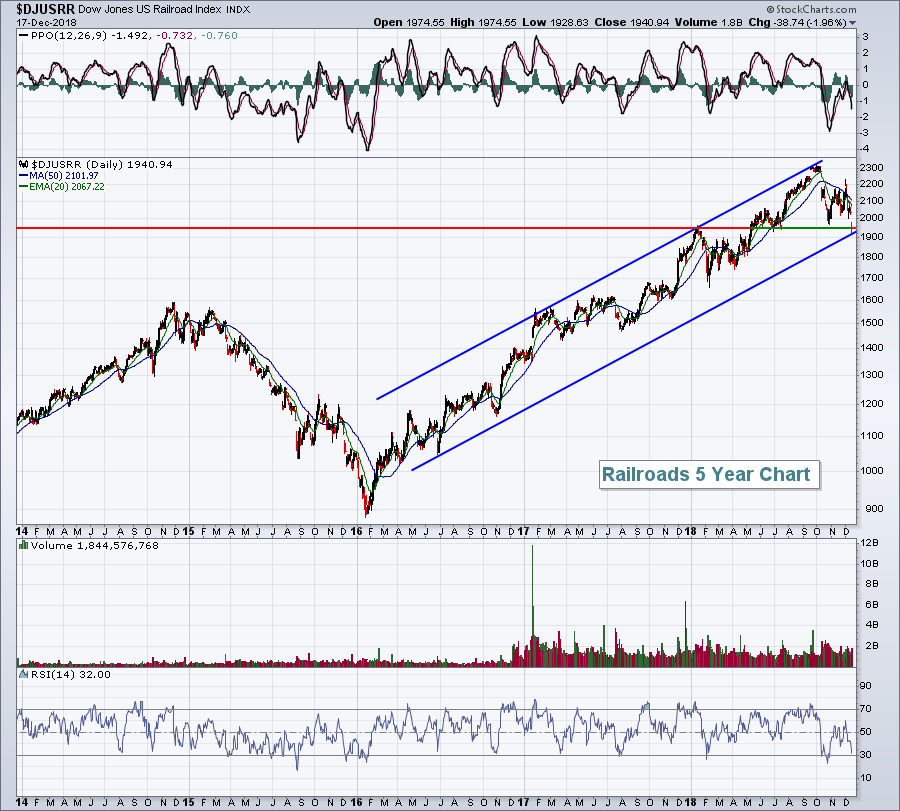
Railroads ($DJUSRR, -1.96%) are always an important cue of the U.S. economy as they ship goods in North America only. When railroads struggle, it's generally not a good sign for U.S. stocks. While I mentioned above that railroads closed at their lowest level since May, there is still a bit of technical hope left:
 By connecting the highs throughout the current uptrend, we see a clear trendline resistance. If we click on this line and drag it to the low in mid-2016, we see that it currently intersects both price support and yesterday's close on the group. It would be difficult to argue bullish technical outcomes for the DJUSRR if the 1900 level is lost. Railroads are at a crossroad. Where we go from here will matter.
Historical Tendencies
Mondays have easily been the worst calendar day of the week since 1950. The S&P 500 has produced annualized returns of -15.71% on Mondays over the past seven decades. Yesterday was simply more of the same.
Key Earnings Reports
(actual vs. estimate):
DRI: .92 vs .92
FDS: 2.35 vs 2.28
NAV: 1.89 vs 1.68
WOR: .58 vs .73
(reports after close, estimate provided):
FDX: 4.05
JBL: .85
MU: 2.93
Key Economic Reports
November housing starts released at 8:30am EST: 1,256,000 (actual) vs. 1,221,000 (estimate)
November building permits released at 8:30am EST: 1,328,000 (actual) vs. 1,255,000 (estimate)
Happy trading!
Tom
