Market Recap for Tuesday, December 4, 2018
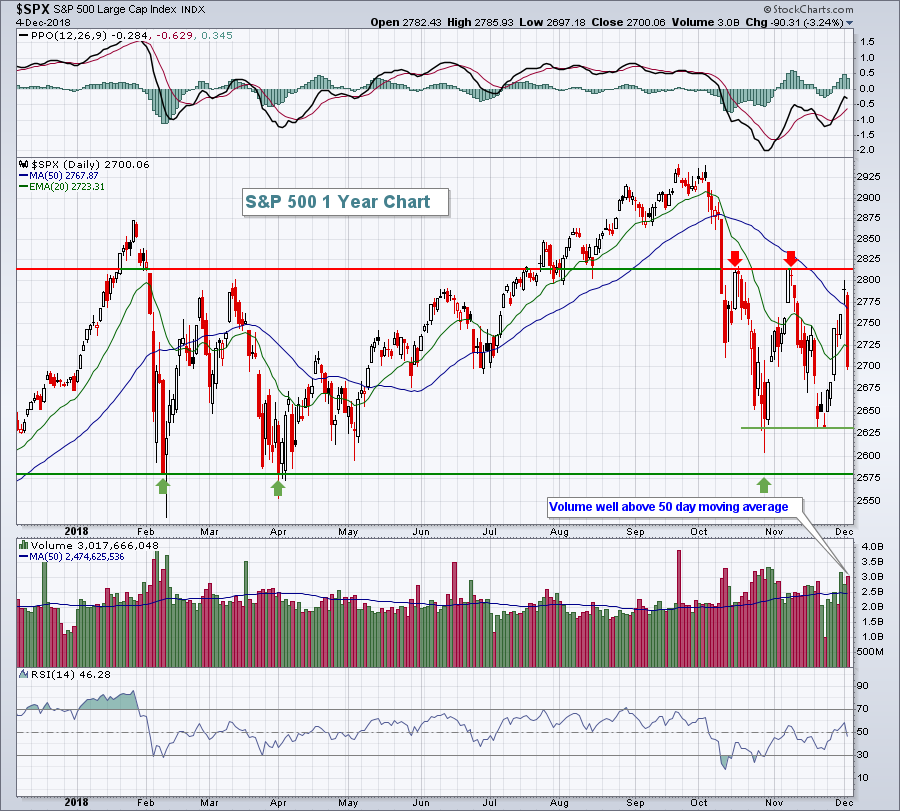
Don't be swayed by market commentary that discusses lack of volume yesterday as a positive. First of all, the Dow Jones fell 800 points. 800!!! And that's somehow a positive? We lost 20 hour EMA support on the intraday chart without a fight. We later lost 20 day EMA support without a fight. Oh, by the way, volume was not light. Check out this S&P 500 chart:
 Listen, I have a lot of respect for Art Cashin, the UBS Director of Floor Operations at the NYSE, and regular CNBC commentator. But his comment that "to some degree, it's a buyers' boycott. If you're going to see the Dow down 800, you would expect you'd see somewhat of a stampede" was puzzling. Sorry Art, I saw a stampede.
S&P 500 volume was over 3 billion shares (well above average volume) - and a major price support level was not even lost. I've said this before and I'll say it again. The current U.S. stock market action reminds me a lot of late-2014 through early-2016. Many technical signals were lined up for a bear market, but price support from that initial high volatility drop in late-2014 was never violated. That's the critical piece that the bears were missing. In my view, we're at a very similar stage with S&P 500 price support of 2582 still holding. Otherwise, technical signals are very weak. Volume trends are awful. I am still looking at this current market environment as a correction within a continuing bull market, but I'm trading with extreme caution because of the bearish conditions. The Volatility Index ($VIX) soaring off 16 support is yet the latest signal that we need to keep in mind. I am 100% cash at the moment and plan to stay that way through the early action tomorrow and then I'll re-evaluate. If I do trade, it'll likely be more defensive areas and with fewer shares. There's no shame in avoiding risk when the market warrants it.
Utilities (XLU, +0.07%) was the only sector to gain ground yesterday. Of the losers, aggressive sectors were hit the hardest. Financials (XLF, -4.35%), industrials (XLI, -4.25%), technology (XLK, -3.79%) and consumer discretionary (XLY, -3.60%) all lost more than 3%. Falling treasury yields were the primary culprit for the underperformance of financials as the 10 year treasury yield ($TNX) tumbled and failed to hold yield support near 3.00%. The TNX closed yesterday at 2.92% as the huge one month decline in yields accelerates - not a good signal for the U.S. economy, despite what the Fed may be saying.
Pre-Market Action
The U.S. stock market is closed today. It will re-open tomorrow morning. Asian markets were lower overnight and European markets are roughly 1% lower this morning.
It's early, but Dow Jones futures thus far are pointing to a slight recovery at tomorrow morning's opening bell, but much can change between now and then.
Current Outlook
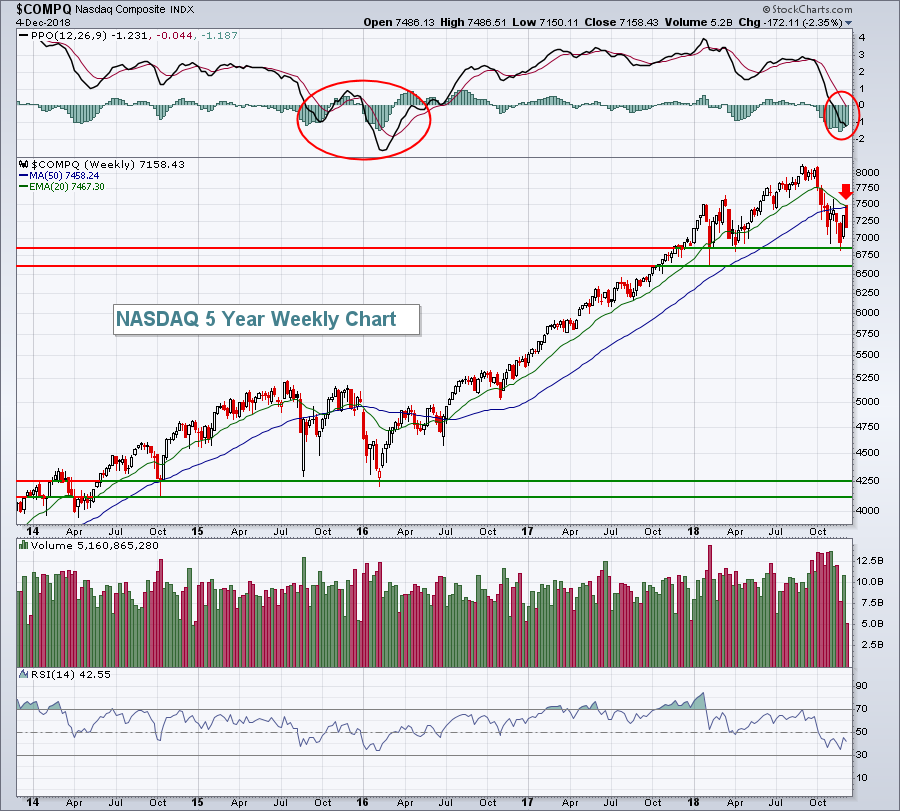
On the weekly chart, the NASDAQ failed exactly as it touched overhead 20 week EMA resistance. This reversal and bearish action lines up with bear market tendencies. Again, I'm not declaring this to be a bear market just yet. Rather, I'm simply pointing out the bear market behavior. Here's the chart:
 The weekly PPO moving into negative territory is problematic, though not confirmation of a bear market. A bear market requires a negative weekly PPO, but not every bearish PPO crossover into negative territory results in a bear market. As an example, check out 2015/2016. The weekly PPO turned negative during a consolidation/basing phase of the bull market and that could be happening right now. There's no denying that 20 week EMA failure (red arrow), however. When you study bear markets, you'll see that type of market behavior repeatedly. So what does all this mean? Not much - yet. Clearly, we need to be cautious. I'm cautiously bullish. But "cautiously" bullish is quite different than "head-in-the-sand" bullish. Let's sit back and watch to see how this plays out. I'd rather be in cash for awhile as the market settles down or even rallies....than to be fully invested during an impulsive selling episode and meltdown.
Sector/Industry Watch
The past three months have been difficult for U.S. equities and yesterday's action was simply another exclamation point. But there hasn't been selling everywhere. Can you name the best performing industry group over the past three months?
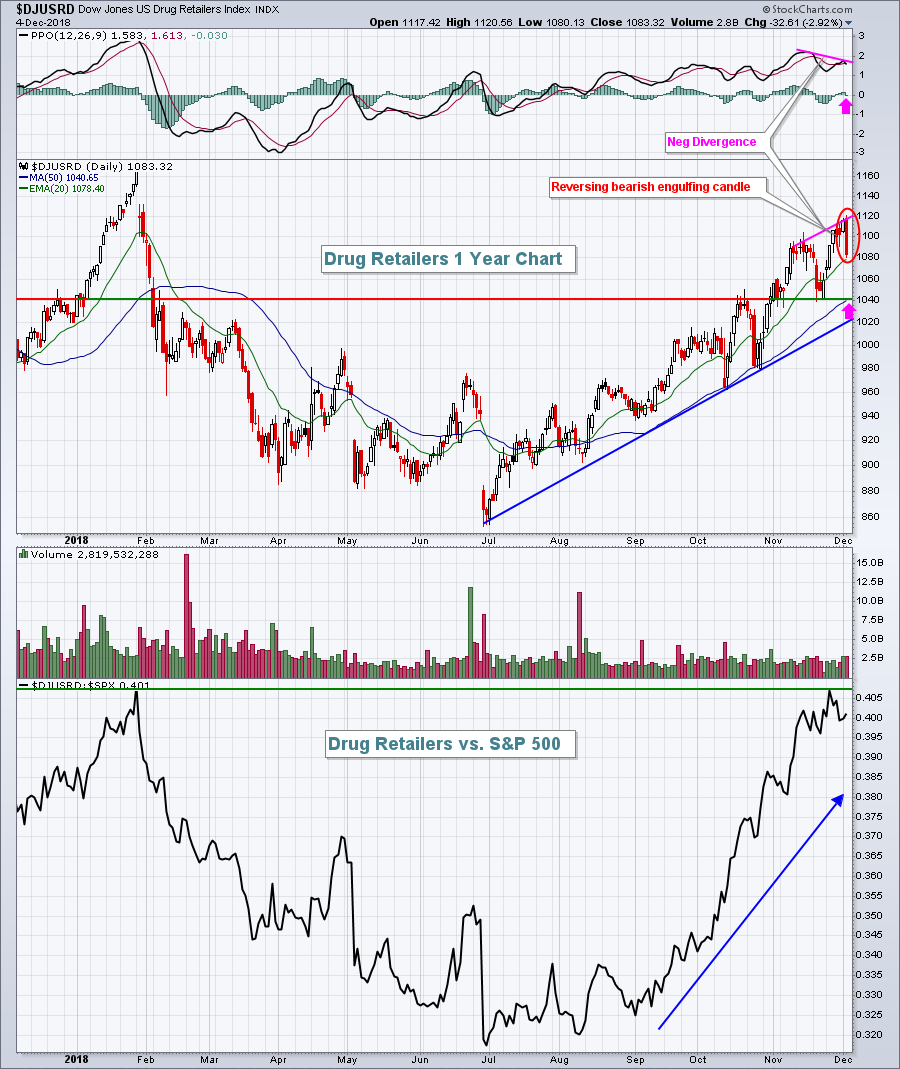
Drug retailers ($DJUSRD, +15.13%). Here's what this correction looks like in the world of drug retailers:
 What correction, right? The uptrend is running into technical problems, though. There's a negative divergence in play that, coupled with a bearish engulfing candle yesterday, suggests there's more selling ahead. The pink arrows mark areas of retreat that I'd look for. However, a move down to 1040 or so would likely set up solid reward to risk entry into this space.
Historical Tendencies
You certainly wouldn't know it from yesterday's rout on Wall Street, but December is the best calendar month of the year for both the S&P 500 and Russell 2000. On the NASDAQ, December ranks behind only January as its best calendar month of the year. Here are December's annualized returns for each index:
S&P 500 (since 1950): +19.51%
NASDAQ (since 1971): +23.44%
Russell 2000 (since 1987): +34.08%
Key Earnings Reports
(reports after close, estimate provided):
OKTA: (.11)
SNPS: .78
Key Economic Reports
U.S. stock market is closed today to honor President George H.W. Bush
Beige book to be released at 2:00pm EST
Happy trading!
Tom
