Market Recap for Wednesday, December 12, 2018
The opening gap higher on Wednesday added to the recent stock market advance and the bulls stretched those early morning gains into the afternoon session. But much of those intraday profits faded as the session wore on and an across-the-board advance really didn't feel so great by day's end. Let's start, however, with the good news. It was mostly a "risk-on" type of day, with leadership coming from communication services (XLC, +1.07%) and consumer discretionary (XLY, +1.05%). Meanwhile, defensive sectors were lagging for a change as both real estate (XLRE, -1.89%) and utilities (XLU, -0.63%) suffered losses. Another positive is technology's (XLK, +0.78%) 5.09% recovery from Monday's intraday low to Wednesday's intraday high. That easily topped the S&P 500's 3.96% advance over the same period. But that was about where the good news ended.
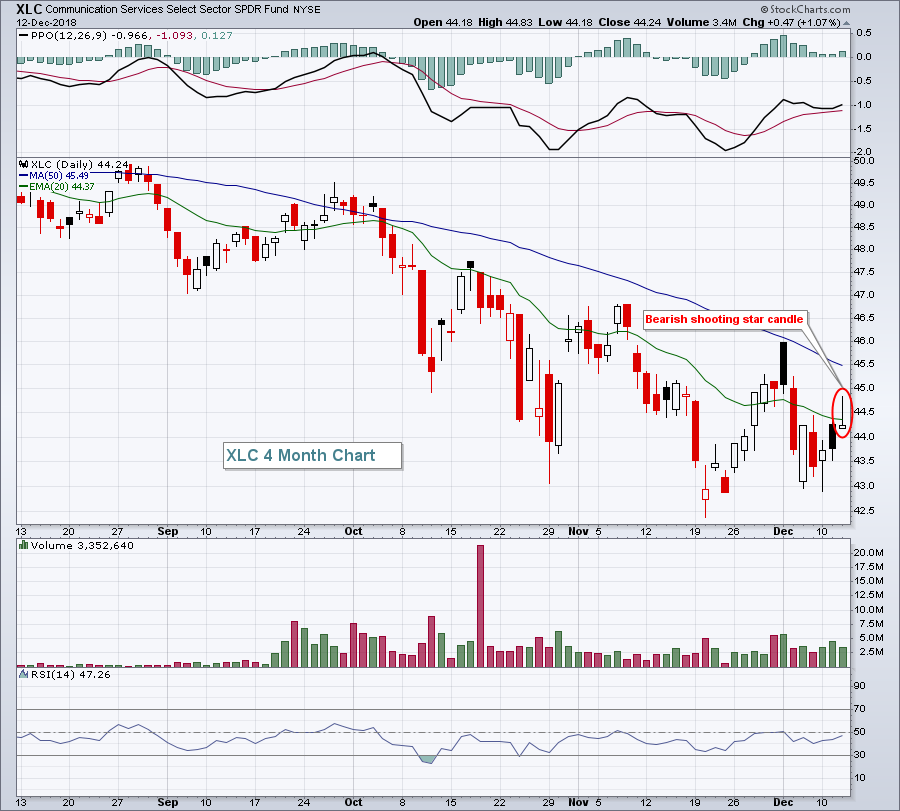
The aforementioned sector leader yesterday (XLC) printed an ominous shooting star candle at its declining 20 day EMA. That often results in further downside short-term so be on the lookout for that today:
 That long tail highlights the trading that took place yesterday above its key 20 day EMA, but unfortunately it also highlights the failure.
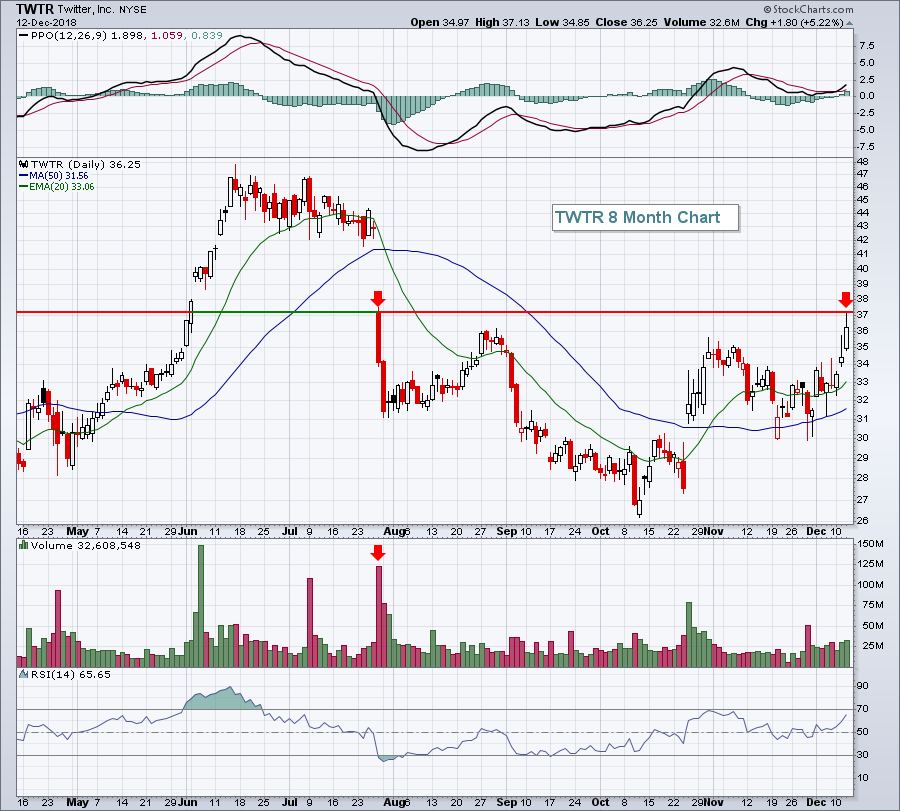
Twitter (TWTR, +5.22%) was a big reason for strength in communication stocks, but it is now testing major overhead gap resistance. It'll be difficult to close above yesterday's intraday high:
 While I doubt we'll see that breakout on the first attempt, a breakout would be bullish and could lead to a quick trip into the low-40s to challenge the top of gap resistance.
Pre-Market Action
A much-better-than-expected initial jobless claims report (206,000 vs. 228,000) was not enough to spur selling in the treasury market. Traders there yawned as the 10 year treasury yield ($TNX) dropped a basis point to 2.89%. It's generally not a good sign when the bond market doesn't react to bullish economic data.
Asian markets were strong overnight, but Europe is mixed. Dow Jones futures are higher by 5 points with less than 20 minutes to the opening bell.
General Electric (GE) is likely to be heavily traded today as a bearish analyst from JP Morgan says a bottom is near for GE and upgraded the stock after having a sell rating for two years.
Current Outlook
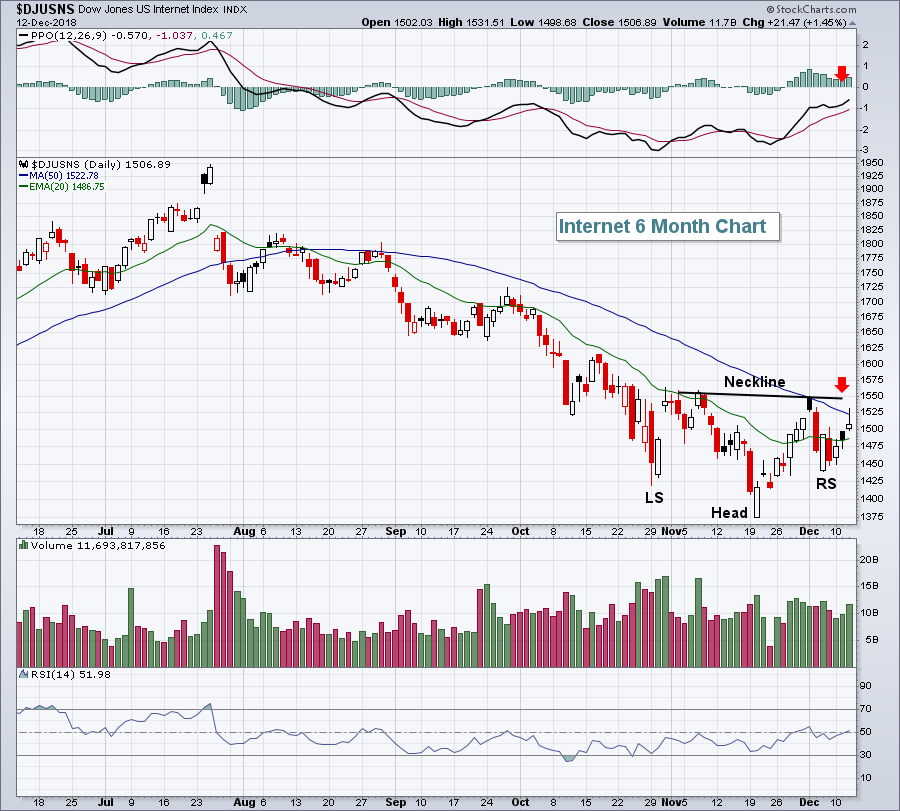
Internet stocks ($DJUSNS, +1.45%) have struggled since Facebook's (FB) implosion after they provided their disastrous guidance back in July that included a major reduction in operating margins over the next two years. They're attempting to carve out a reverse head & shoulders bottoming pattern and confirmation of this pattern (ie, a breakout) would go a long way in aiding the resumption of the 9+ year bull market. Check it out:
 A breakout above the 1550-1560 level would be a bullish development for sure. A PPO centerline breakout would also be bullish. If you look at the above chart since July, you'll see a series of lower highs and lower lows. A head & shoulders bottoming formation tells a story of slowing downside momentum as the right side of the neckline produces a high equal to the left side. The breakout above the neckline suggests that the momentum has shifted from bearish to bullish.
Honestly, I have my doubts about the pattern above. It certainly could turn out to mark a major bottom and there's no doubt a breakout would be bullish. I'm just not a fan of downsloping necklines because it highlights the fact that we couldn't clear the prior high. Accordingly, another push lower simply confirms the downtrend we've been in. Therefore, I'd view the above head & shoulders bottoming formation with guarded optimism.
Sector/Industry Watch
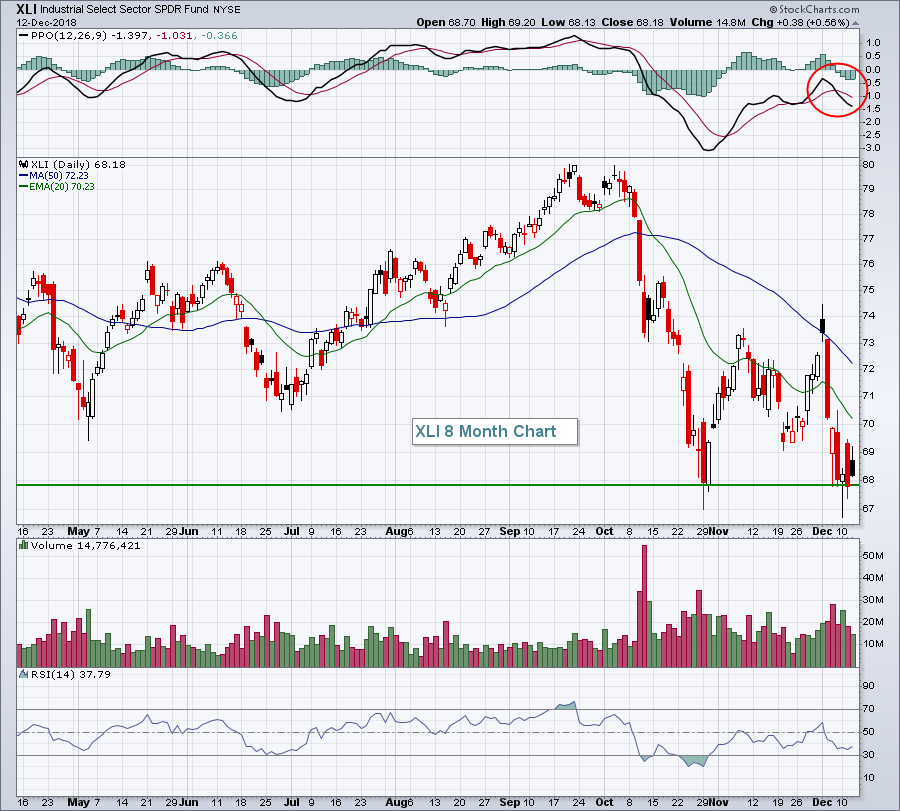
One problem with the recovery the past couple days is that both financials (XLF) and industrials (XLI) have had limited upside moves. These are two aggressive sectors that need to participate on rallies and they really haven't. The lack of a move higher in the 10 year treasury yield ($TNX) paints a weakening economic outlook and that, too, adds to the bearishness in these two groups. The following is a current picture of industrials:
 Despite the recent rally, the XLI remains on the verge of a significant breakdown beneath price support. This failure to respond to a rally suggests to me that the current overall market rally is not likely to last.
Historical Tendencies
The 11th calendar day of the month through the 18th calendar day of the month are bullish every month.....except December. For some reason, there tends to be weakness until December 15th. Then we typically see bullish action in the second half of December.
Key Earnings Reports
(actual vs. estimate):
CIEN: .53 vs .49
(reports after close, estimate provided):
ADBE: 1.88
COST: 1.62
Key Economic Reports
Initial jobless claims released at 8:30am EST: 206,000 (actual) vs. 228,000 (estimate)
Happy trading!
Tom
