Market Recap for Thursday, November 29, 2018
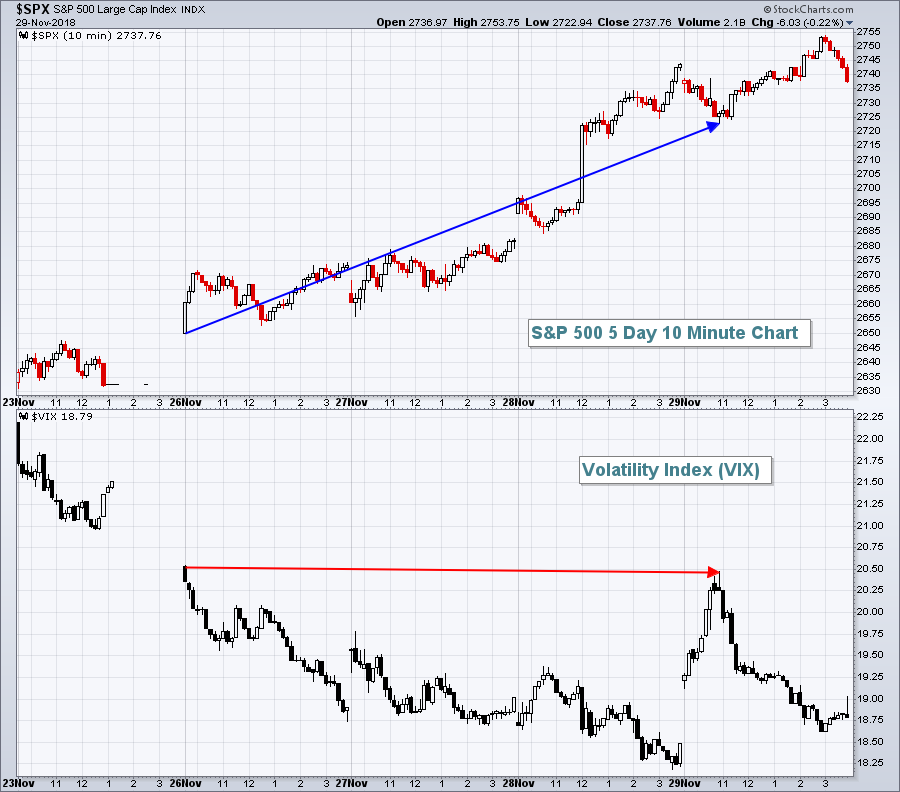
Before I discuss strength and weakness from the mixed action on Thursday, let me first say that the Volatility Index ($VIX) remains one of my biggest fears about the current state of the market. In the morning yesterday, the VIX touched its high from Monday despite the S&P 500 trading much, much higher than it did on Monday:
 The VIX did settle back down by the end of Thursday's session, but the sudden spike near its weekly high on a poor initial jobless claims report suggests we might want to wear our crash helmets next Friday if that monthly jobs report is disappointing. Through years of studying market implications of a high VIX, I've taken away one important lesson. When the VIX is elevated, the stock market does not handle bad news well at all. In a full-fledged bull market with a VIX in the 10-11 range, you can throw just about any shock at the U.S. stock market and it'll have little impact. In a high VIX environment, however, the game changes. Bottom line? I'm still very concerned about another bout of impulsive selling. It makes for a difficult choice because none of us wants to miss the next rally if the 10 year bull market resumes, but we also don't want to hold on if we see another big selloff.
On to yesterday's action.
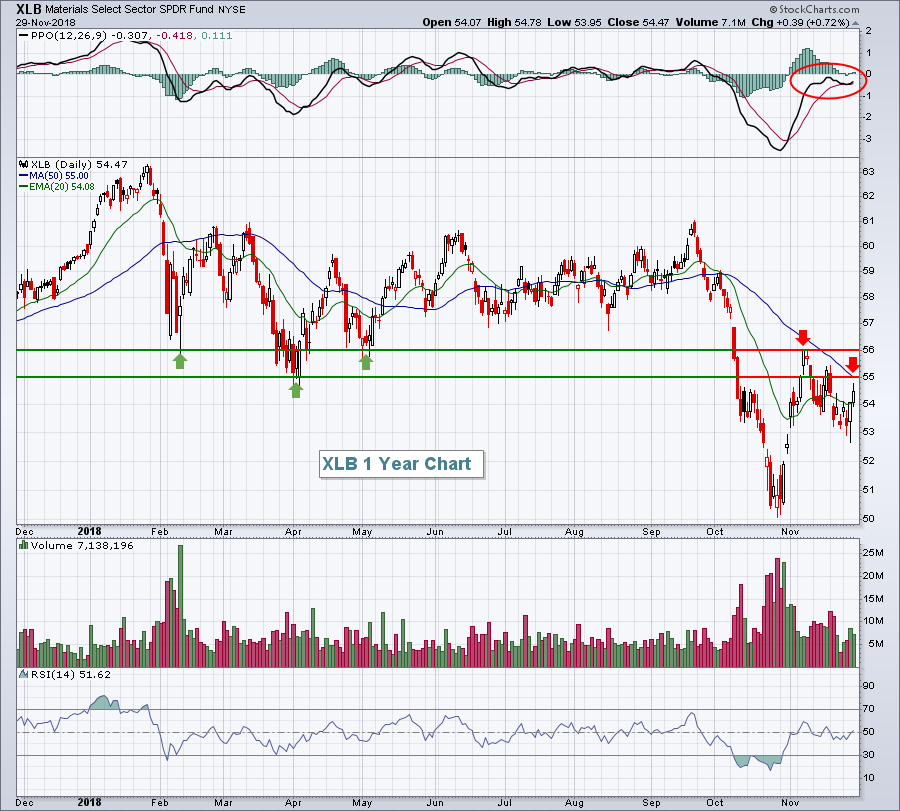
The dollar (UUP, -0.15%) was lower for a second consecutive session and that was enough for materials (XLB, +0.72%) to lead for a second day. Technically, however, there's overhead resistance that must be negotiated and I remain bullish the dollar on a forward-looking basis, which will make it difficult for materials to gain much ground. For now, however, here's the outlook:
 The recent oversold bounce in the XLB has taken the PPO back near centerline resistance (red circle) and price action into an overhead zone where I'd expect to see sellers continue to line up. In addition to overhead price resistance, the 50 day SMA has fallen to 55.00, which coincides with a key price resistance level. I'd be a seller of materials. The bullish argument would likely revolve around a breakdown in the U.S. Dollar Index ($USD) and I just don't see that happening.
Energy (XLE, +0.65%) also led yesterday on a relative basis, continuing to bounce off its recent intermediate-term price support near 64. Therefore, our leadership in an attempt to continue our rally comes from the two sector ETFs with the lowest SCTRs. Folks, that's not what we want to see on a serious bull market advance. Wednesday's bullishness in all of our aggressive sectors saw very little follow through and that's a concern.
The bottom of the sector leaderboard included technology (XLK, -0.97%) and financials (XLF, -0.85%), two aggressive areas that gave up a portion of what it had gained on Wednesday. An aggressive industry like semiconductors ($DJUSSC, -1.04%) closed above its 20 day EMA on Wednesday and then promptly surrendered it again yesterday. I'm not saying this rally cannot continue, but continuing with poor leadership would suggest it's unsustainable.
Pre-Market Action
The U.S. Dollar Index ($USD) is slightly higher this morning with gold ($GOLD) and crude oil ($WTIC) slighly lower. Asian markets rallied last night, but just fractionally. In Europe this morning, we're seeing mostly fractional losses. Dow Jones futures are down 69 points with less than 30 minutes to the opening bell, but they are well off of earlier lows.
Current Outlook
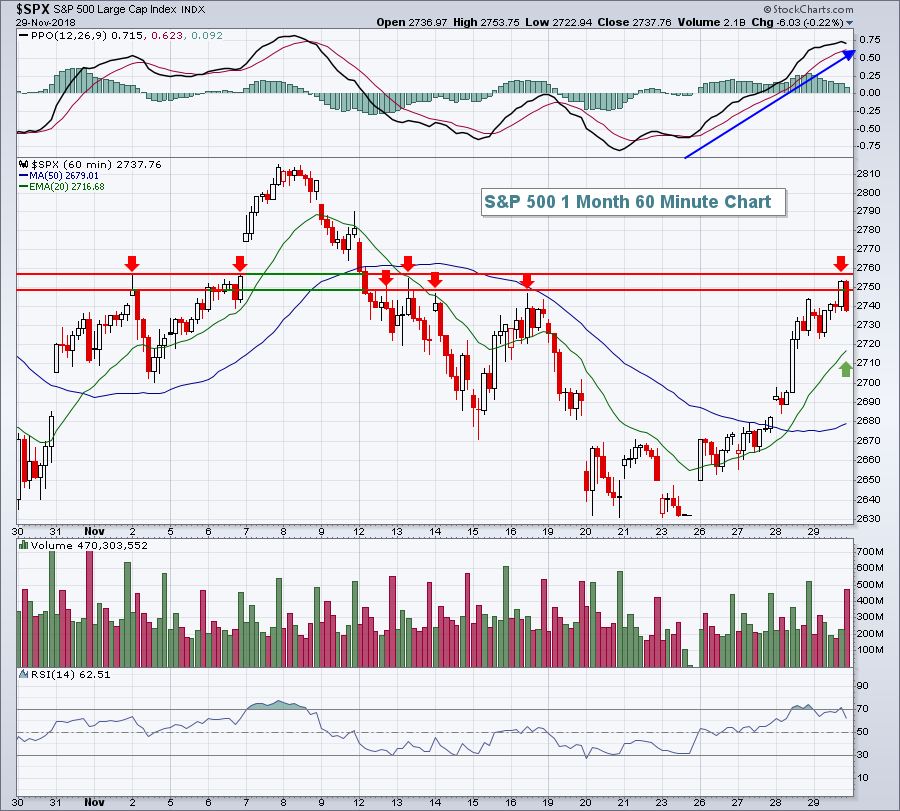
From last week's intraweek low to its intraweek high, the S&P 500 enjoyed a bounce of roughly 5%. As this rally unfolds, the short-term reward to risk favors the bears, at least until the bulls can clear overhead price and moving average resistance. Here's the intraday chart to highlight key short-term resistance:
 Over the past 30 days, you can see by the number of red arrows how many times the S&P 500 has failed in the 2750-2760 area. That's exactly where the S&P 500 reversed late in the day on Thursday. Futures are pointing to a lower open this morning. We'll want to watch the rising 20 hour EMA for initial support. If that were to fail, I'd grow much more cautious the near-term action.
Sector/Industry Watch
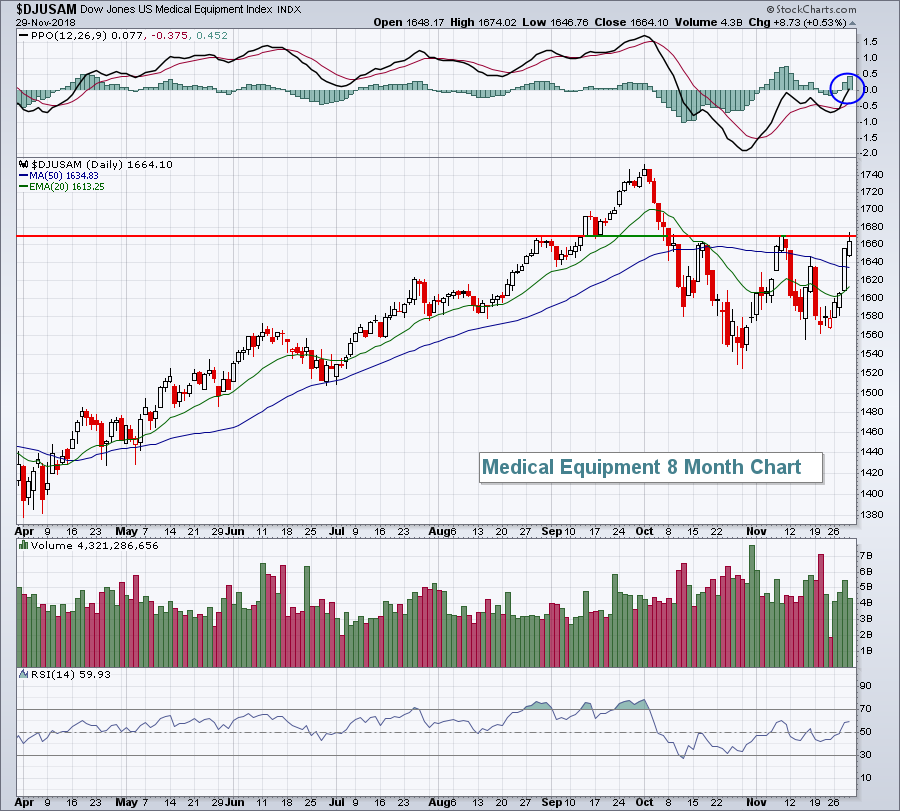
Healthcare's (XLV) best two month stretch of the year (relative to the S&P 500) is December-January. Health care providers ($DJUSHP) and medical equipment companies ($DJUSAM) are two primary reasons why as both tend to perform very well over the next two months. The following is the current chart of the latter:
 The DJUSAM is just now seeing a bullish PPO centerline crossover, but we haven't seen a price breakout to confirm this signal. Given the seasonal bullishness in December and January, a breakout above 1670 should be viewed positively for this industry group.
Historical Tendencies
Apple (AAPL) has averaged negative returns during only two calendar months over the past two decades:
September: -2.5%
December: -1.1%
On a relative basis to the benchmark S&P 500, AAPL's worst month is December. Technically, the chart on AAPL is a wreck too with gap resistance and the declining 20 day EMA near 186 and 190, respectively.
Key Earnings Reports
None
Key Economic Reports
November Chicago PMI to be released at 9:45am EST: 58.0 (estimate)
Happy trading!
Tom
