Market Recap for Tuesday, November 27, 2018
One highlight from Tuesday's action is that the U.S. Dollar ($USD, +0.31%) remains in favor as it nears yet another breakout. This is important on a number of fronts, especially with respect to gold ($GOLD, -0.74%). There's been a very solid inverse relationship between the direction of GOLD and the direction of the USD for decades. When the USD is on the rise, GOLD significantly underperforms the benchmark S&P 500. When the opposite is true, GOLD is a major beneficiary:
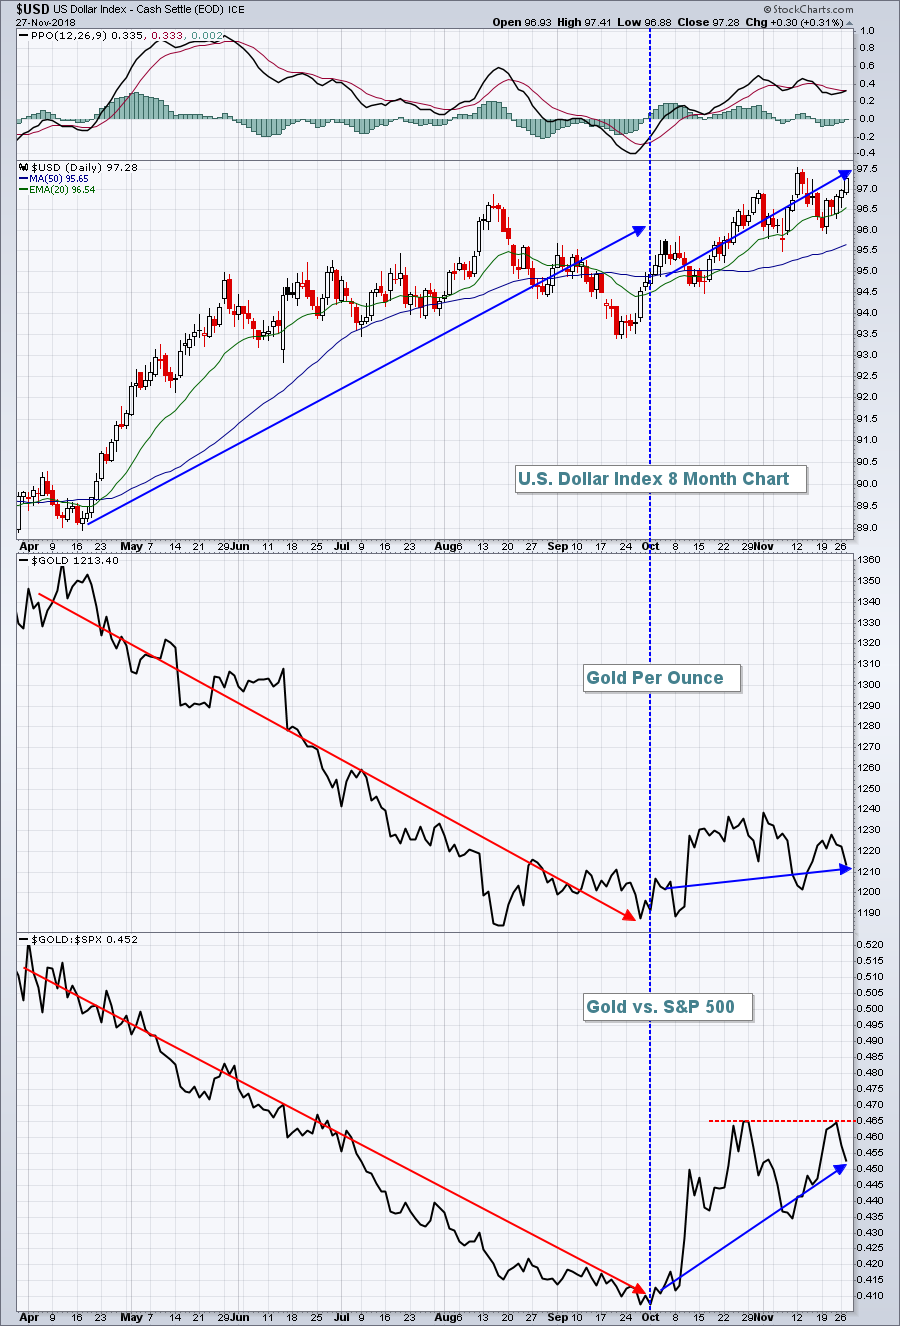 Until early October, the normal inverse relationship was clearly in place. The USD was strong in 2018 and gold suffered both on an absolute and relative basis. But the USD has been trending higher since early October, while gold performs solidly on both an absolute and relative basis. What gives? Well, first I would stress that this is very likely a short-term positive correlation. We are likely going to see either the USD drop or gold rally. I doubt we're going to see them move in the same direction for much longer. So why the positive correlation the past two months? I think it's the fear factor. Gold is typically a destination for money when the Volatility Index ($VIX) spikes. The Fed Chair's speech today could have a major impact on the dollar and, more indirectly, gold.
While we saw strength in many areas of the market on Tuesday, the majority of it was in defensive sectors as healthcare (XLV, +1.04%), consumer staples (XLP, +0.89%), utilities (XLU, 0.75%) and real estate (XLRE, +0.54%) led the advance. Not good. Meanwhile, the worst performing group was materials (XLB, -1.22%). On a year-to-date basis, the XLB has fallen 10.84% and lags every other sector. And the dollar is the primary culprit. Check out how the dollar impacts the relative strength (or lack thereof) of materials stocks:
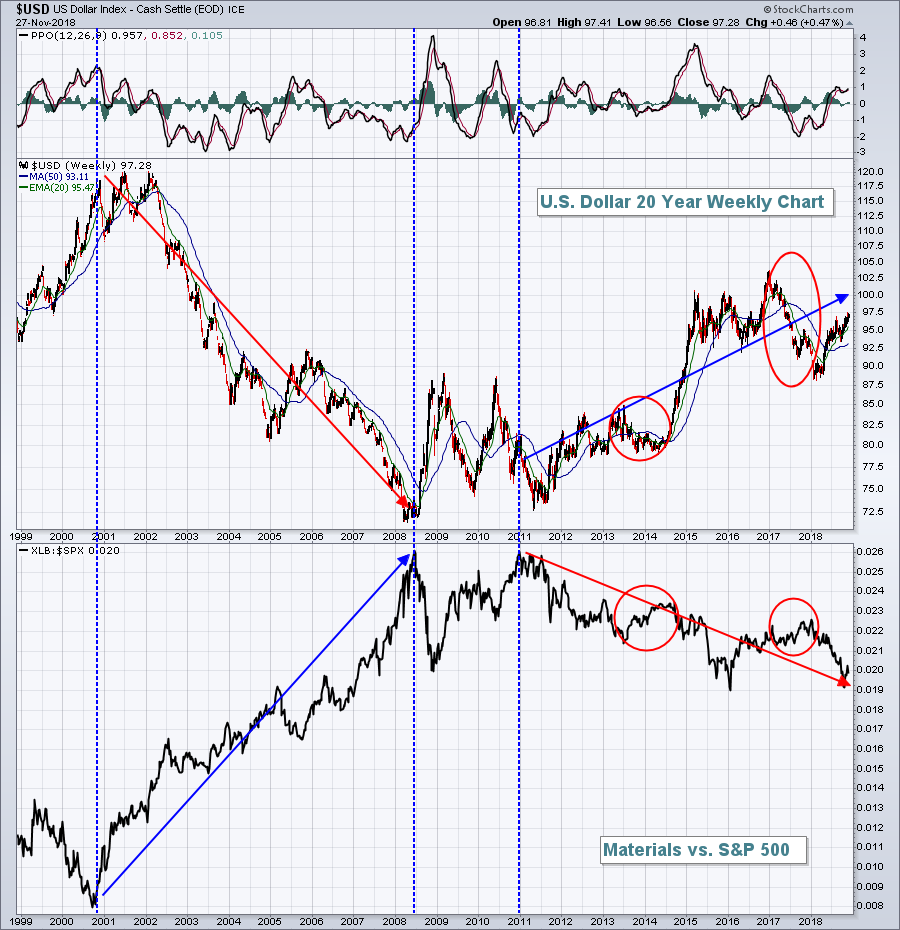 Could this relationship be any clearer? If you're wondering when commodities will participate in this decade long bull market, well first understand that the XLB has participated. The XLB was below $15 at the 2009 bear market low. Yesterday, the XLB closed at $53.26. The sector has definitely participated. But it's participated to a far lesser degree than other sectors. Hence, the relative downtrend (XLB:$SPX) on the chart above. The XLB is not likely to give you better than average market returns until the uptrend in the dollar ends. That will require other global economies strengthening at a faster clip than the U.S. For the near-term, that's not likely.
Pre-Market Action
Futures are strong once again as traders prepare for a noon (EST) speech from Fed Chairman Powell. President Trump has been highly critical of the Fed Chair for continual hawkish behavior and forecasts. Some market pundits are speculating that Powell might even address recent comments from the President. No matter which way this goes, traders will be looking to glean more information from the Fed not only regarding the likelihood of another rate hike at next month's FOMC meeting, but also their forecast of hikes in 2019. I, for one, believe that if Fed Chair Powell appears to be in a more accommodating mood, it could significantly boost U.S. equities. If he remains more hawkish, then our next leg lower could begin.
Asian markets were very strong overnight, but it's a mixed picture this morning in Europe. As the opening bell approaches, Dow Jones futures are higher by roughly 160 points.
Current Outlook
Transportation stocks ($TRAN) are always important to watch as they're a solid indication as to what the market believes about our economy on a forward-looking basis. Airlines ($DJUSAR) are currently performing quite well, no doubt buoyed by rapidly-declining crude oil prices ($WTIC). I've discussed railroads on several occasions and like the group so long as their 50 week SMA and early 2018 price lows hold as support. That leaves us with the weakest area - truckers ($DJUSTK):
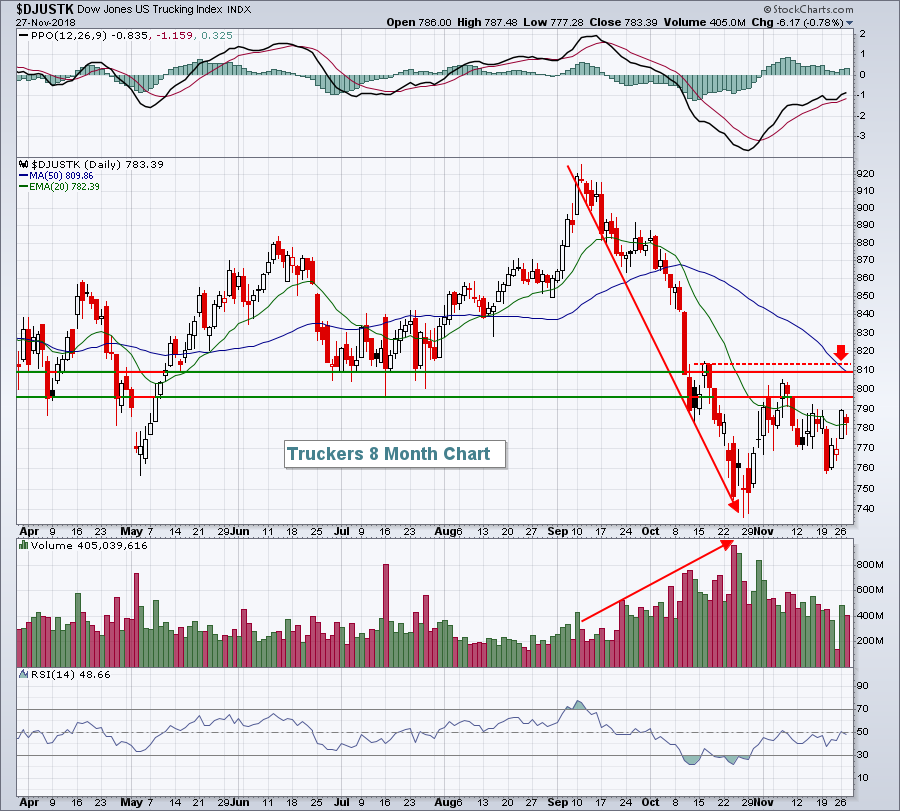 Truckers were hit earlier than many other areas during this correction and the September and October selling took place on accelerating volume. So while two-thirds of transportation might be okay technically, the DJUSTK is not. There's much overhead resistance and the horizontal lines highlight the resistance zone (795-815) to watch. The falling 50 day SMA is currently at 809, right in the middle of price resistance. The bulls no doubt have their work cut out for them.
Sector/Industry Watch
Since its April 2018 high, renewable energy ($DWCREE) has been an extremely poor performer, losing half of its value in six months, but recent strength has left this aggressive group challenging a couple key technical levels:
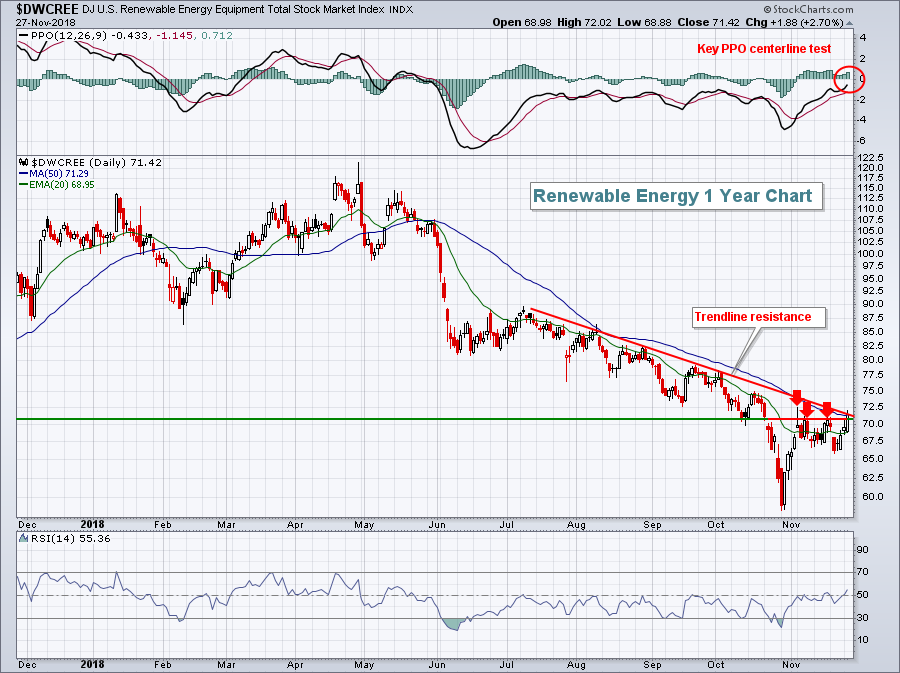 After breaking down in late October, the DWCREE has rallied strongly in a flag pattern. The short-term good news is that yesterday's high cleared prior November tops. The bad news is that trendline resistance and PPO centerline resistance is now being tested. There's more work to do here, but the chart definitely looks encouraging.
Historical Tendencies
HanesBrands, Inc. (HBI) has a very interesting and unusual seasonality history. Many stocks post their best historical results from November through January, but HBI is the polar opposite. HBI has average gains in every month from February through October, but has posted negative returns during November, December and January over the past two decades and it's been downtrending for the past 3 1/2 years:
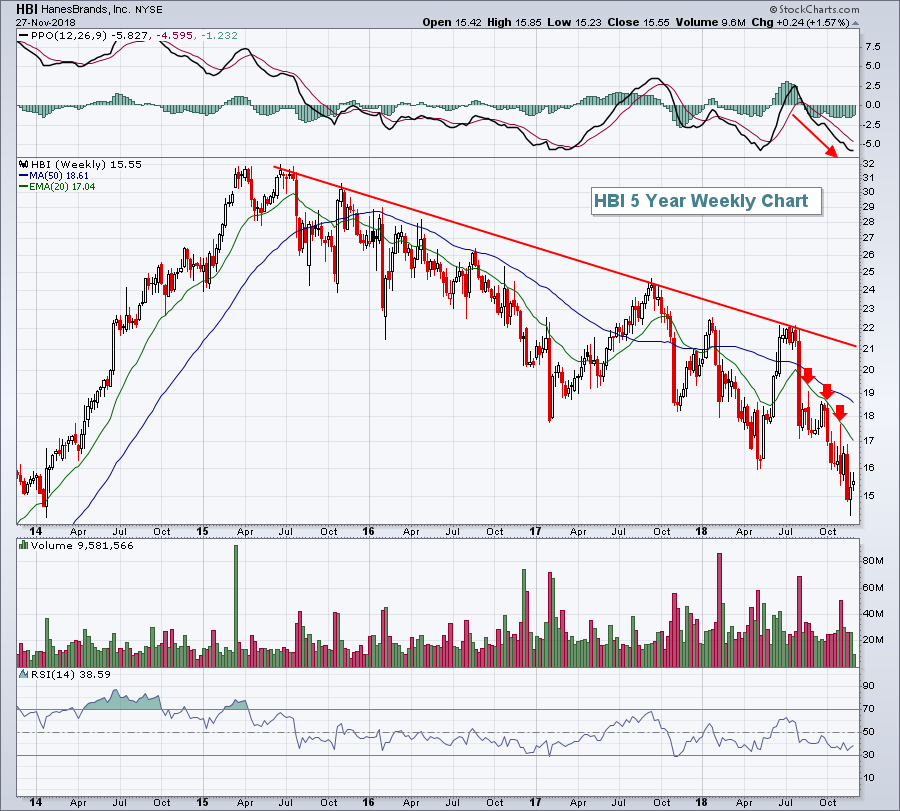 The selling in HBI has been fairly intense over the past several months, so a short-term bounce could be in order. But I doubt we'll see a move through its declining 20 week EMA. Several tests there have failed (red arrows) and given the upcoming bearish historical period, the odds are certainly stacked against HBI bulls in the intermediate-term.
Key Earnings Reports
(actual vs. estimate):
BURL: 1.21 vs 1.06
RY: 1.71 vs 1.61
SINA: .93 vs .74
SJM: 2.17 vs 2.35
TIF: .77 vs .76
WB: .75 vs .74
(reports after close, estimate provided):
VEEV: .38
Key Economic Reports
Q3 GDP 2nd estimate released at 8:30am EST: 3.5% (actual) vs. 3.5% (estimate)
October wholesale inventories released at 8:30am EST: +0.7% (actual) vs. +0.4% (estimate)
October new home sales to be released at 10:00am EST: 575,000 (estimate)
Happy trading!
Tom
