Market Recap for Tuesday, November 13, 2018
Losses weren't big on Tuesday as the Dow Jones dropped just 0.40% and was the worst performing of our major indices. But it seemed to be more of a continuation of the recent downtrend as all key areas of the market finished at or close to their lows of the day. For instance, the NASDAQ earlier in the session was up 118 points, or more than 1.5%, but finished the day higher by 0.01 points. Considering that the NASDAQ had been down 370 points, or nearly 5%, in the prior three trading sessions, a bounce was definitely a short-term possibility. But the early strength couldn't hold and that suggests we're looking at lower prices ahead.
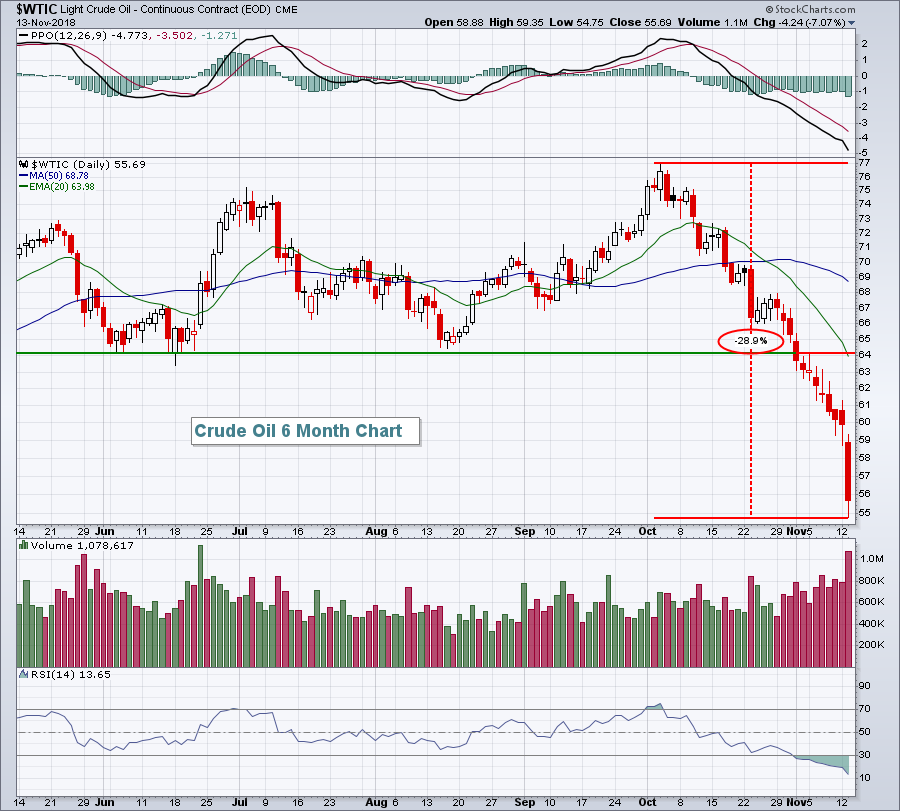
Crude oil ($WTIC, -7.07%) fell more than $4 to close at $55.69 per barrel and that had traders exiting energy stocks (XLE, -2.30%) in droves. It marked the 12th consecutive session that crude oil has closed lower, another record, but none of the previous day's drops were anything close to Tuesday's. Perhaps it was capitulatory. We'll find out today. We have seen a complete reversal from early October in many areas, but few compare to crude oil prices. Check this out:
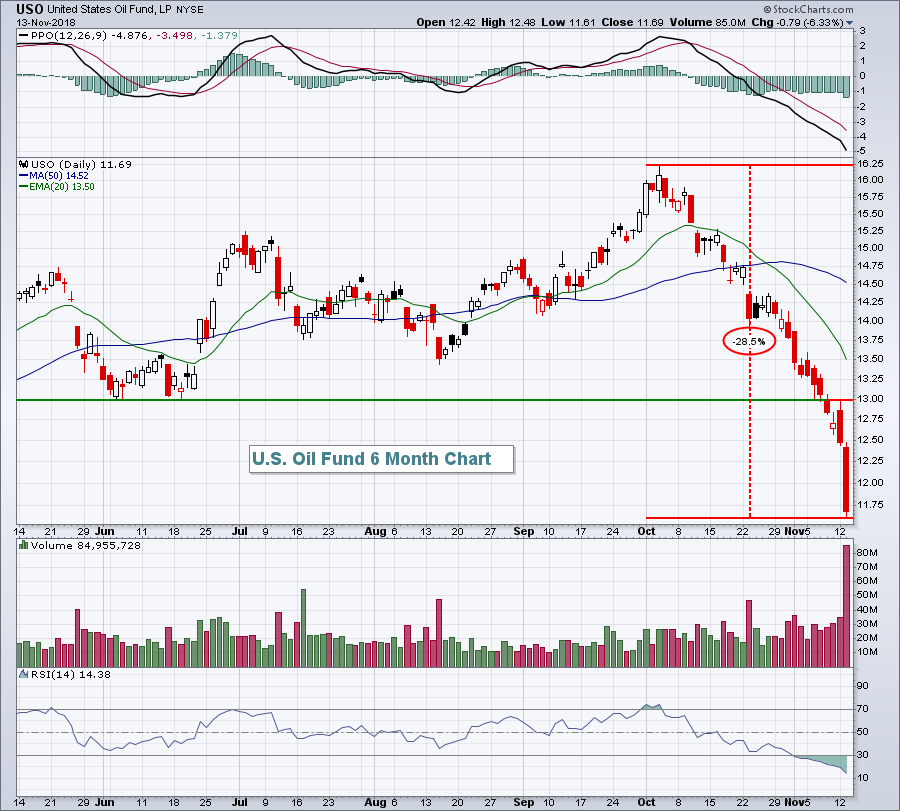
 A 29% drop in 6 weeks is not a normal pullback. There are many influences in the price of crude oil, many of which are very difficult to predict. So I've found technical analysis to be lacking at times in forecasting crude oil price movement. That, in turn, makes it more difficult to trade energy stocks, in my opinion. Nonetheless, prior support on crude was near $64 per barrel and we are now extremely oversold on black gold with a daily RSI reading of 13. Rarely do we see any chart with an RSI of 13. So we'll likely get a bounce soon, perhaps a large one. If you're in the camp believing this selloff is overdone, trading the United States Oil Fund (USO) on the long side for a short-term recovery makes sense. Just remember, oversold can become more oversold. But.....here's the USO chart:
 It doesn't track crude oil perfectly, but close enough. Given yesterday's volume of more than 80 million shares, I'd say a capitulatory bottom is at hand.....or very close.
The rest of the stock market yesterday was quite mixed. Financials (XLF, +0.56%) showed relative strength despite a 4 basis point drop in the 10 year treasury yield ($TNX) to 3.15%. Outside of energy, healthcare (XLV, -0.70%) was the worst performing sector as health care providers ($DJUSHP, -1.01%) dropped on further short-term profit taking.
Pre-Market Action
Crude oil ($WTIC) is trying to snap its 12 day losing streak. At last check, the price of crude was up nearly 1% after a monumental, breathtaking, record breaking fall from its early October high. The 10 year treasury yield ($TNX) is higher by 1 basis point to 3.16% and gold ($GOLD) is flat as the U.S. Dollar ($USD) is mixed vs. foreign currencies this morning.
Asian markets were mostly lower overnight, while European indices are fractionally higher this morning. Dow Jones futures are higher by 108 points with roughly 30 minutes left to the opening bell as bulls try to reverse the recent slide.
Macy's (M) is up less than 1% after blowing past its quarterly EPS estimate and raising guidance based on its upcoming Christmas holiday expectations. Personally, I would have expected a much more bullish reaction. This could be a case of good news already being built into Macy's and perhaps other retailers as well. Hhhhmmmmm.......
Current Outlook
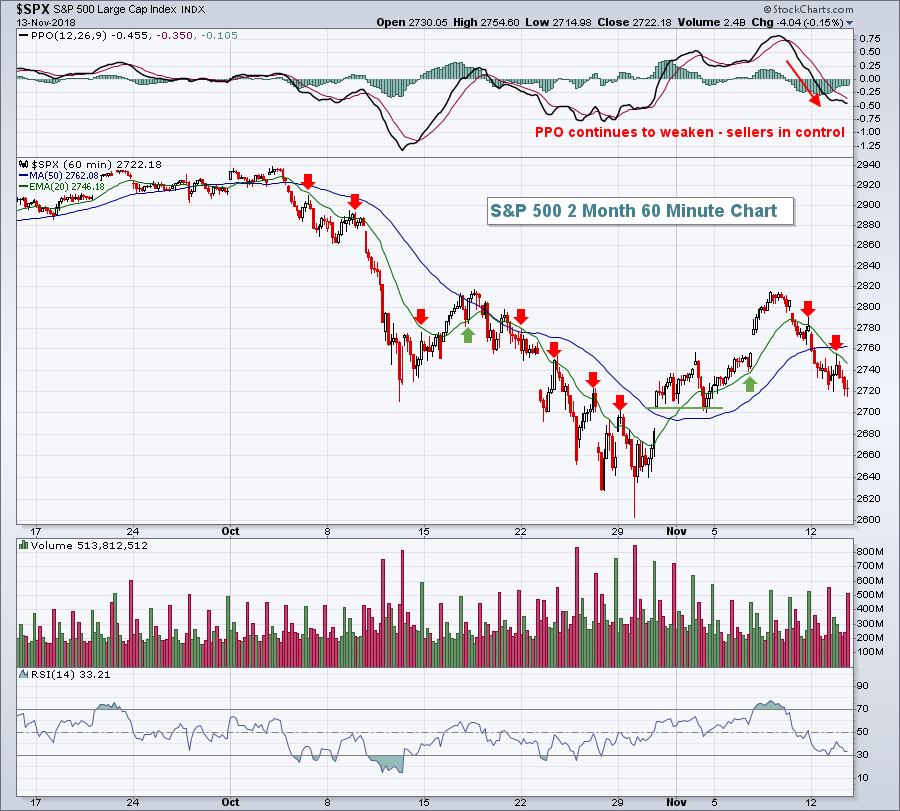
The S&P 500 is trending lower and the 60 minute chart makes that point fairly clear:
 They say a picture paints a thousand words. In technical analysis, it may paint a few thousand words. Until we see a definitive break back above the 20 day EMA or a positive divergence (higher PPO on lower price), it would be wise to remain cautious near-term.
Sector/Industry Watch
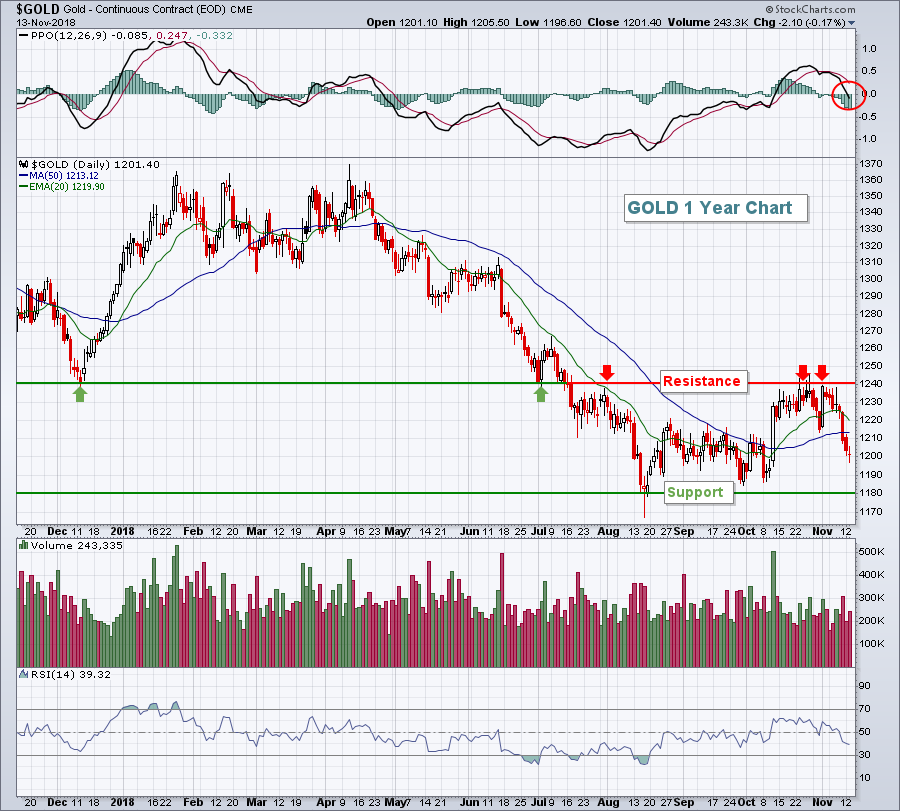
Gold ($GOLD) has been under selling pressure once again and we've now seen the daily PPO cross back below centerline support. That is particularly bad news as the weekly PPO is negative and bearish as well. So the longer-term chart is telling us that sellers are in charge and the short-term chart has just seen its momentum turn bearish. Here's the chart:
 The range for now is 1180-1240, but given the bearish momentum and surging U.S. Dollar ($USD), I'd look for a minimum of an 1180 retest.
Historical Tendencies
The S&P 500 has posted average annual returns of 9% since 1950. Wednesdays have produced annualized returns of +20.09%, making "Hump Day" the best calendar day of the week for U.S. equities.
Key Earnings Reports
(actual vs. estimate):
CGC: (.76) vs (.12)
GOOS: .35 vs .19
M: .27 vs .14
(reports after close, estimate provided):
CSCO: .72
NTAP: .99
NTES: 2.70
WPM: .10
ZTO: .18
Key Economic Reports
October CPI released at 8:30am EST: +0.3% (actual) vs. +0.3% (estimate)
October Core CPI released at 8:30am EST: +0.2% (actual) vs. +0.2% (estimate)
Happy trading!
Tom
