Market Recap for Wednesday, November 21, 2018
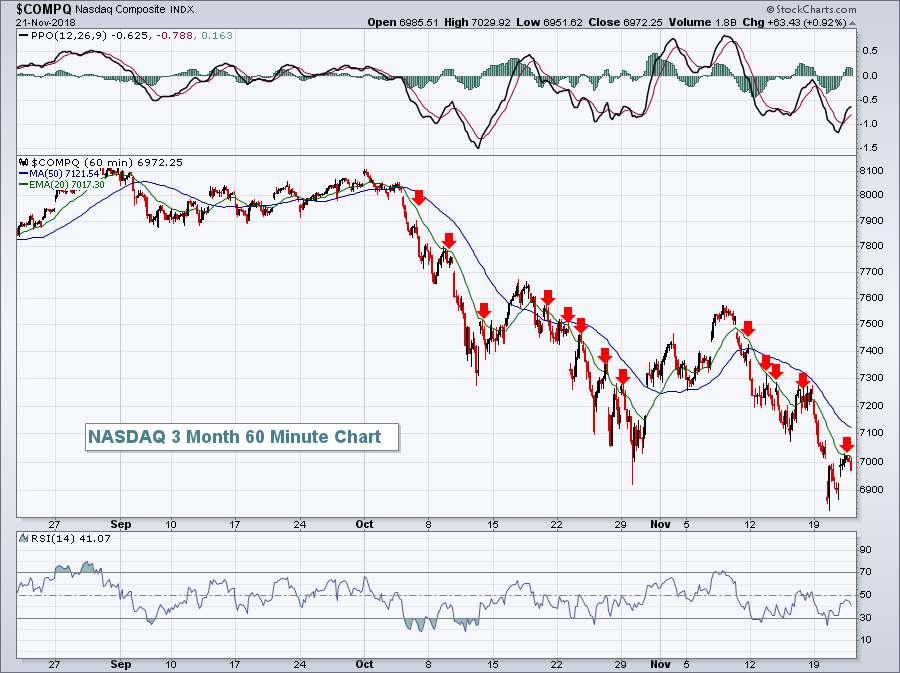
Wall Street was mostly higher on Wednesday, although, by just about any other measure, it was a disappointing session. The early morning gap higher was essentially where the bullishness ended and there was a slow drift lower throughout the balance of the day. The NASDAQ rose just enough to challenge its declining 20 hour EMA, but never could get the burst it needed to clear this short-term hurdle:
 The red arrows mark many short-term tops and they illustrate the difficulty of penetrating this key moving average.
End of day selling actually resulted in a minor loss on the Dow Jones, although the other major indices finished in much better position - all gaining ground on the session.
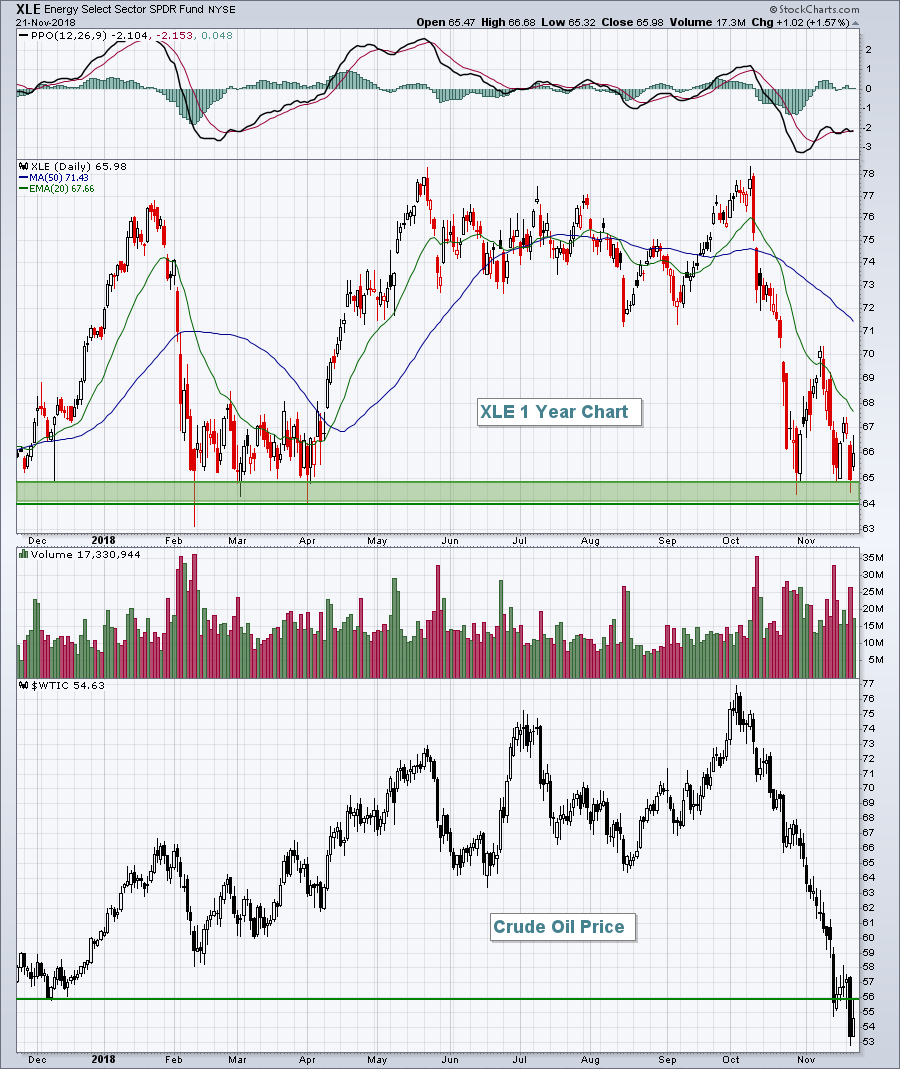
Among sectors, energy (XLE, +1.57%) bounced to hang onto very important 2018 support in the 64-65 area, despite crude oil prices setting year-to-date lows below $53 per barrel on Tuesday:
 A breakdown of support on the XLE would be another check mark in the bear's column as the more technical sell signals we get, the more difficult it'll be for the broader market to rally.
Defensive sectors definitely lagged Wednesday as both utilities (XLU, -1.48%) and consumer staples (XLP, -0.80%) failed to participate in the rally.
Pre-Market Action
Futures are once again pointing much lower as we approach the opening bell on one of the most historically bullish calendar days of the year - see Historical Tendencies section below. Dow Jones futures are lower by 177 points as crude oil prices ($WTIC) are cratering once again this morning, down another 7% (!!!) to $50.75 per gallon, a level not seen in over a year. There were multiple lows in the $40-$42 per barrel range in 2016 and 2017 and it now appears we could be heading down to that area - a very bearish signal about the global economy.
Current Outlook
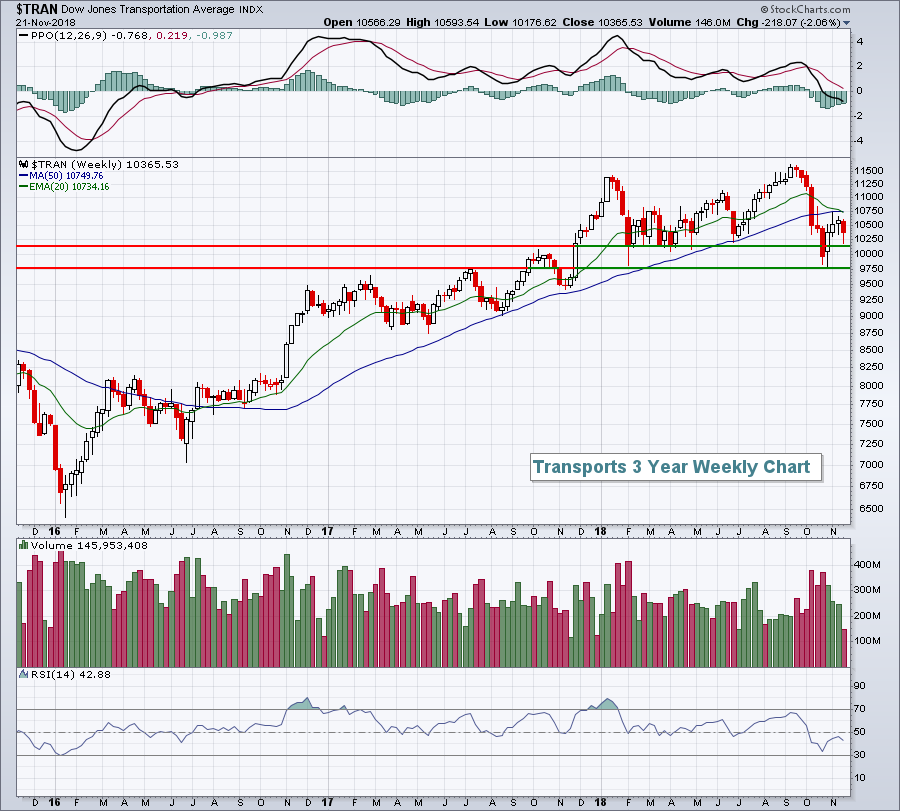
The S&P 500 has yet to test the most important support level (in my opinion) at 2582. However, transportation stocks ($TRAN) actually moved below their February low and bounced. I think it's important for transports to hold onto support. A bull market is not a bull market without transportation stocks participating. Here's a quick look at the weekly chart on the TRAN:
 The importance of those February lows is that extremely high volatility accompanied that selloff to establish a panicked low. History tells us that when the "kitchen sink" is thrown at the stock market and fear is running wild, MAJOR price support levels are established. It's very important that these support levels hold for buyers to have the courage to risk capital. And if the support is lost, many traders will head for the exits.
Sector/Industry Watch
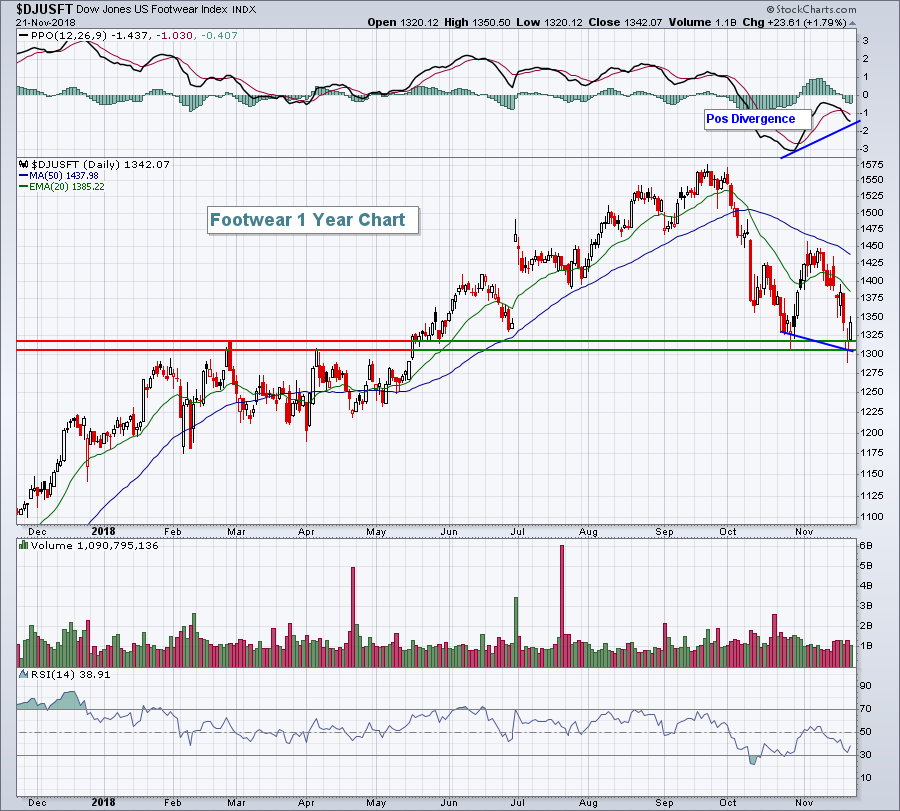
Footwear ($DJUSFT, +1.79%) had been a market leader until, like so many other groups, September/October rolled around. Since then, there's been a lot of selling, but the DJUSFT seems to have hit a rather important level of support with a positive divergence in play:
 If a previously bullish group like footwear struggles to trade higher with so many technical buy signals, that'd be a clue of further weakness ahead.
Historical Tendencies
The Friday after the Thanksgiving Day holiday has been one of the most bullish days of the year. Since 1971, the NASDAQ has risen 38 times and fallen just 9 times on the Friday after Thanksgiving Day, producing annualized returns of +116.85%. It's risen during each of the last six years, but that's nowhere near the consecutive year record. The Friday after Thanksgiving Day has twice risen 13 consecutive years - from 1989 through 2001 and also from 1974 through 1986. In 47 years, the only time we've seen a drop of more than 1% was in 2009 when the NASDAQ fell 1.73%. It's risen more than 1% on six different occasions with the high being in 2000, when the NASDAQ rose an astonishing 5.41%.
Key Earnings Reports
None
Key Economic Reports
November PMI composite flash to be released at 9:45am EST: 54.8 (estimate)
Happy trading!
Tom
