Market Recap for Thursday, November 1, 2018
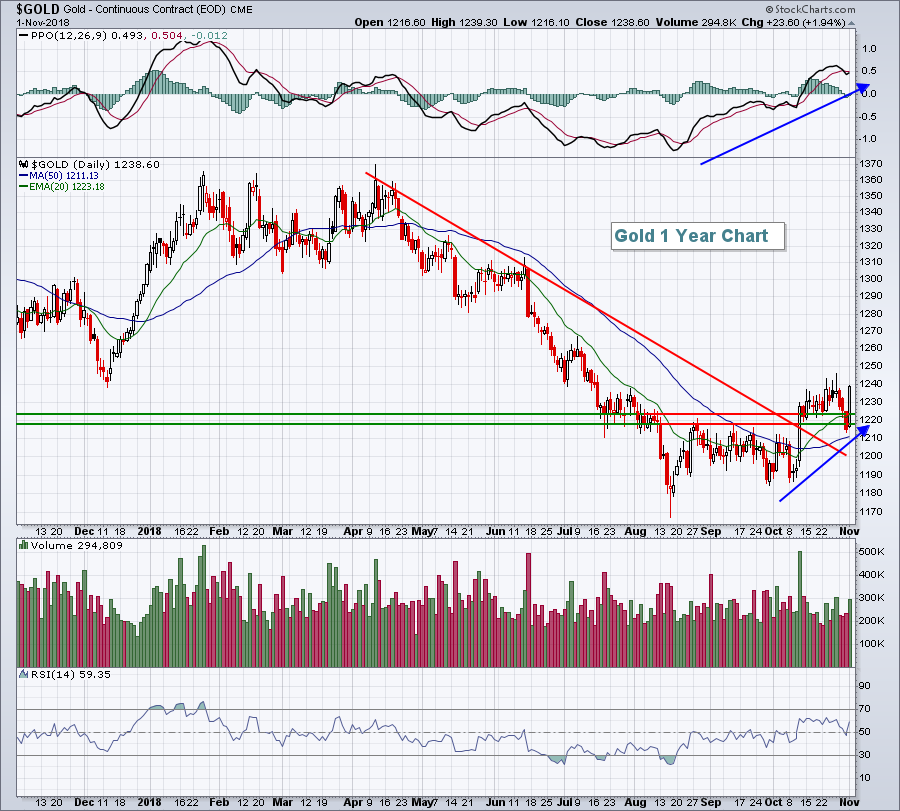
The U.S. Dollar Index ($USD) absorbed its largest decline in several months and that finally triggered buying in the materials sector (XLB, +2.81%). Gold ($GOLD) was a big beneficiary for sure as it climbed nearly 2%, one of its largest advances of 2018, to close at $1238 per ounce, its highest close since mid-July. I'm not a big fan of gold as I believe the USD will move higher again later in 2018 and into 2019 and that will provide very stiff headwinds for GOLD, which normally travels opposite the dollar. Nonetheless, at least for a day, GOLD has recovered back above its 20 day EMA, a bullish short-term development:
 The downtrend line was broken a few weeks ago and the PPO has turned positive. Wednesday's move lower beneath price support and the rising 20 day EMA underscores the volatility of gold. The metal was certainly oversold and in need of a bounce. The question currently is how high does it go? Gold has a decent chance to push higher so long as the USD doesn't break out again. Eventually I expect that dollar breakout, but short-term selling and consolidation in the USD could lead to further short-term price gains in gold. If I were long gold, I'd consider a move back down beneath Wednesday's low to be my sell signal.
Consumer discretionary (XLY, +2.04%) also performed very well yesterday as gambling stocks ($DJUSCA, +8.58%) and durable household products ($DJUSHD, +5.18%) led a very solid sector. The Chinese territory of Macau reported that October's gambling revenues were the highest since 2014 and many gambling stocks rebounded strongly, including Wynn Resorts (WYNN, +11.96%). Not participating yesterday in the XLY advance was restaurants & bars ($DJUSRU, -0.51%). That is very likely to change today as Starbucks (SBUX) reported a blowout quarter last night and is soaring more than 7% in pre-market trade today.
Utilities (XLU, -0.45%), a defensive sector, failed to participate in Thursday's rally. The other 10 sectors all advanced. Notable industry laggards included mobile telecommunications ($DJUSWU, -1.59%), health care providers ($DJUSHP, +0.24%) and software ($DJUSSW, +0.07%
Pre-Market Action
U.S. futures are mostly higher, although Apple (AAPL) will be a clear drag on the NASDAQ this morning when the bell rings. AAPL's guidance was lower than expected, while Starbucks (SBUX) posted a much-better-than-expected quarterly report, which should provide a nice lift to restaurant stocks ($DJUSRU) today.
The 10 year treasury yield ($TNX) is up 3 basis points this morning to 3.17% after a solid jobs report was released this morning for October. Despite that, however, futures are bifurcated with Dow Jones futures higher by 161 points, while NASDAQ futures are lower by 43 points as we approach the opening bell.
Current Outlook
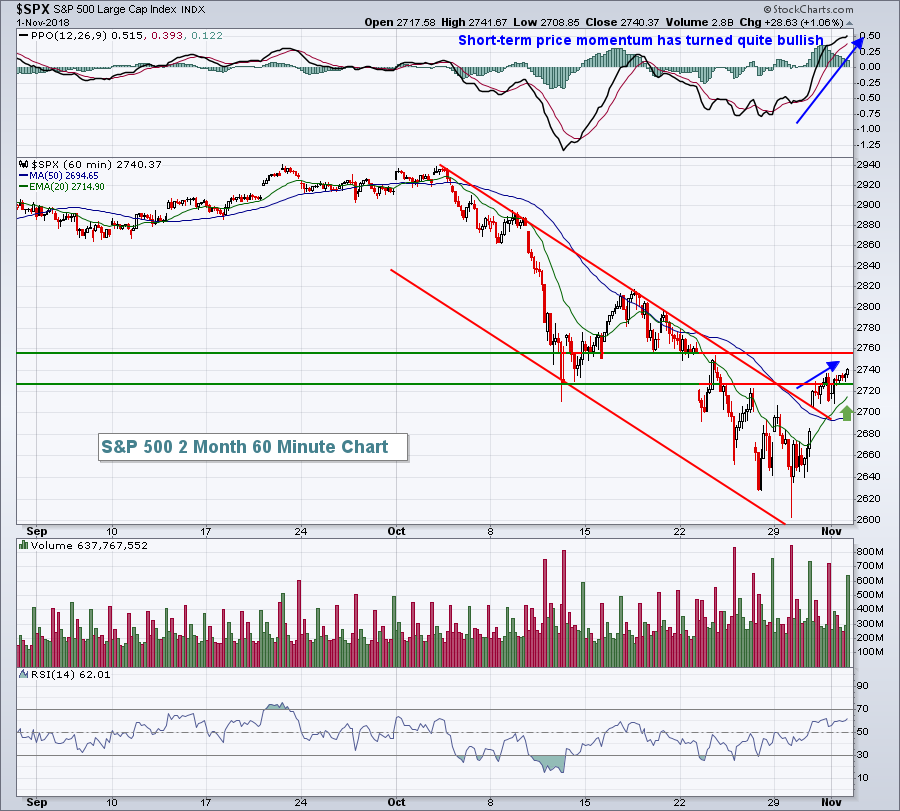
The waves of selling have seemingly come to an end, but I would still caution everyone that the Volatility Index ($VIX) remains above the 16-17 level, which for me suggests potential danger. Trading in this environment is fine, but simply remain disciplined with stops in place in the event we see bouts of panicked selling return. The first price signal that I'd look for would be a sustained move below the rising 20 day EMA (green arrow in chart below):
 Whipsaw action could still be in our near-term future, but unfortunately that's what happens when the VIX remains elevated. At this point, I believe the bottom is in, though the most important price support is 2582, the low close back in February 2018. We have entered the key 2720-2760 price resistance range and are thus far holding up well. The market's reaction today to two major developments - Apple's (AAPL) earnings report and the November nonfarm payrolls report - will be very important. Nonfarm payrolls blew past estimates this morning, but AAPL dropped a bomb with poor guidance. Certainly, I'd look for underperformance in the technology area today, but will AAPL's caution trigger a wider selloff later today? Reversing candles off this week's uptrend definitely would provide a short-term warning sign.
Sector/Industry Watch
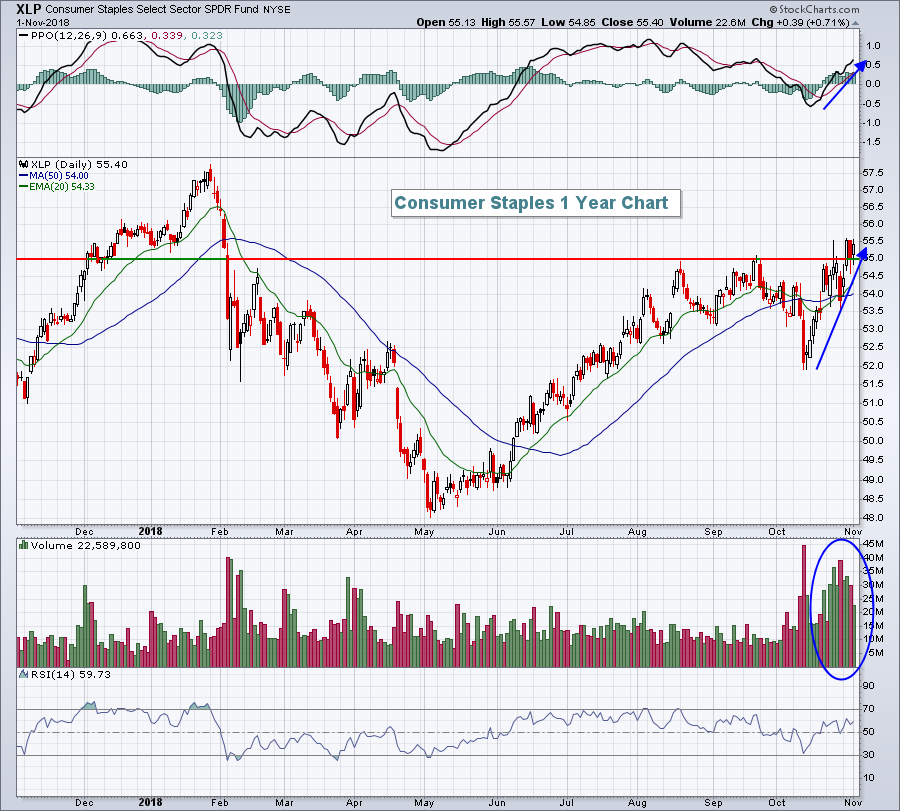
I've discussed the relative strength of defensive sectors quite a bit the past couple months, but these sectors also show absolute strength. Let's take consumer staples (XLP), for example:
 Price momentum is accelerating in bullish fashion, as evidenced by the rapidly rising PPO. Volume has been extremely heavy to accompany the price rise as money has rotated into defensive stocks. The XLP represents a less volatile way to trade in this current environment. If the market continues to strengthen, the XLP may underperform, but I'd expect it to continue to rise - perhaps to test the January high near 57.50 in the short-term. If the market weakens, we'll likely see more money rotate to the XLP, adding to its recent relative strength vs. the benchmark S&P 500.
Historical Tendencies
The S&P 500 performs best from the October 27th close through the January 18th close. Since 1950, this period has produced annualized returns of +20.89%, more than double the 9% average annual return that the S&P 500 has enjoyed over the past 68 years. Throughout the current bull market, only 2016 produced a negative return (-8.98%) during this bullish period. Here are the year by year returns this century:
Period ending January 18th:
2018: +8.41%
2017: +6.51%
2016: -8.98%
2015: +2.95%
2014: +4.49%
2013: +5.24%
2012: +1.83%
2011: +9.52%
2010: +6.83%
2009: +0.14%
2008: -13.68%
2007: +3.56%
2006: +8.40%
2005: +6.27%
2004: +10.54%
2003: +0.46%
2002: +2.08%
2001: -2.29%
2000: +12.22%
2001, 2008 and 2016 are the only three years this century that have produced negative returns from October 27th through January 18th. The historical odds are firmly on the side of the bulls over the next couple months.
Key Earnings Reports
(actual vs. estimate):
ABBV: 2.14 vs 2.01
BABA: 1.40 vs. 1.12
CBOE: 1.06 vs 1.01
CVX: 2.11 vs 2.06
DUK: 1.65 vs 1.53
ENB: .42 vs .42
FTS: .50 vs .49
IMO: .67 - estimate, awaiting results
STX: 1.70 vs 1.55
WLTW: 1.32 vs 1.11
XOM: 1.46 vs 1.21
Key Economic Reports
October nonfarm payrolls released at 8:30am EST: 250,000 (actual) vs. 190,000 (estimate)
October private payrolls released at 8:30am EST: 246,000 (actual) vs. 181,000 (estimate)
October unemployment rate released at 8:30am EST: 3.7% (actual) vs. 3.7% (estimate)
October average hourly earnings released at 8:30am EST: +0.2% (actual) vs. +0.2% (estimate)
Happy trading!
Tom
