Market Recap for Monday, September 24, 2018
Energy (XLE, +1.46%) had a very strong day on Monday, helping to offset what was otherwise a rather poor day for U.S. equities. Technology (XLK, +0.50%) was aided by its four key components - computer hardware ($DJUSCR, +1.17%), internet ($DJUSNS, +0.79%), software ($DJUSSW, +0.57%), and semiconductors ($DJUSSC, +0.41%) - to enable the NASDAQ to rally into positive territory in the afternoon session after opening much lower. The Dow Jones opened lower, but never really saw much buying interest throughout the session as industrials (XLI, -1.71%), consumer staples (XLP, -1.53%), and materials (XLB, -1.40%) weighed.
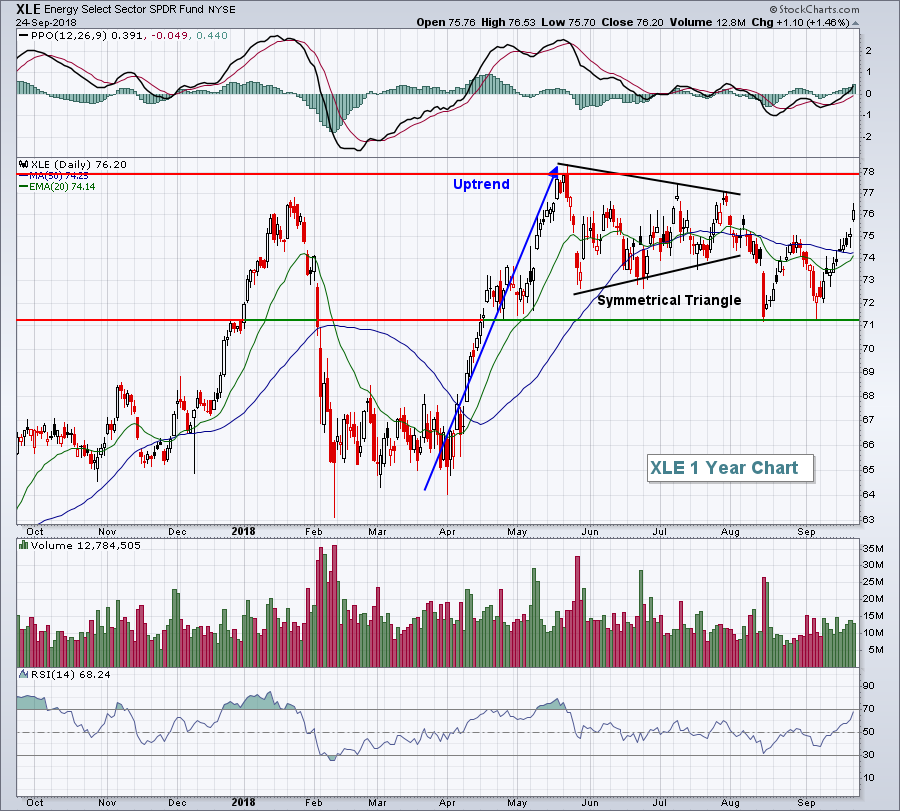
Rotation is critical to a bull market as we don't want to see money leaving the market for extended periods of time. Rather, we simply want to see it leave one sector and find a home in another as technical conditions remain strong in most, if not all, sectors. Energy's strength on Monday had solid timing to aid the bulls, but there's much more work to be done in this sector:
 The selling in August was significant for two reasons. First, it broke a bullish symmetrical triangle continuation pattern to the downside. But perhaps more importantly, established a significant level of price support on that low near 71.00. Three weeks later, that price support level was successfully tested and now we're on a very bullish uptrend. Overhead price resistance in the 77-78 zone will be important to watch.
Industrials were lower for a number of reasons, but primarily because of a weak airlines group ($DJUSAR, -3.14%). The DJUSAR did manage to hold onto its rising 20 day EMA on the close, but their failure to hold onto their most recent price support level at 290 could spell short-term trouble because of a negative divergence in play. Airlines love Q4 so additional weakness down to the 50 day SMA could provide initial entry into the group just before that bullish Q4 arrives.
Pre-Market Action
The 10 year treasury yield ($TNX) is at 3.10% at last check, on the verge of clearing major yield resistance at 3.11%. It would signal significant rotation away from defensive treasuries and into more aggressive equities just as the most bullish time of the year - October through December - arrives.
Crude oil ($WTIC) is up slightly and is now above $72 per barrel.
Asian markets were mixed overnight, while European indices are higher. Dow Jones futures are higher by 67 points with just under an hour to the opening bell.
Current Outlook
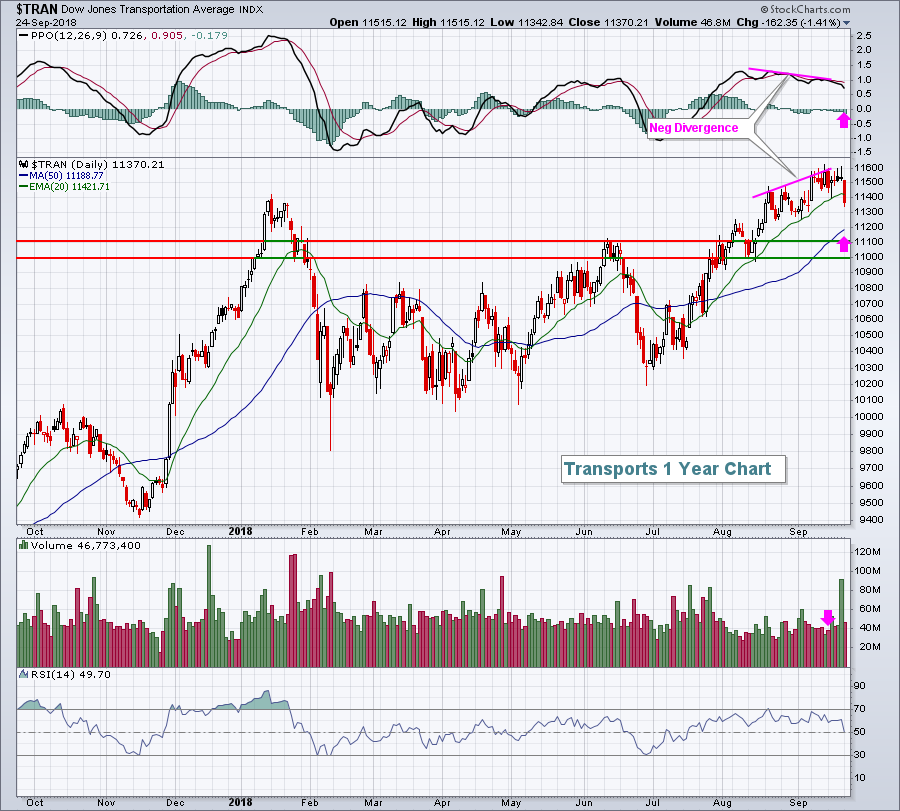
Transports ($TRAN) were hit hard yesterday, falling 1.41%, but this weakness was anticipated. Last Monday, I included a chart that highlighted the negative divergence in play, suggesting a potential trip to the 50 day SMA and/or price support area. Here's a refresher:
 I would expect further weakness over the next couple days to a week to test that rising 50 day SMA. I'd be surprised if the selling took the TRAN below 11000 on a closing basis and let me be very clear - I am bullish transports. The warning signal that I discussed last week was short-term in nature. I view the stock market mostly from a short-term trader's mindset and transports were raising a caution flag temporarily. In the 11000-11200 range, I become much more bullish the group from a reward to risk perspective.
Sector/Industry Watch
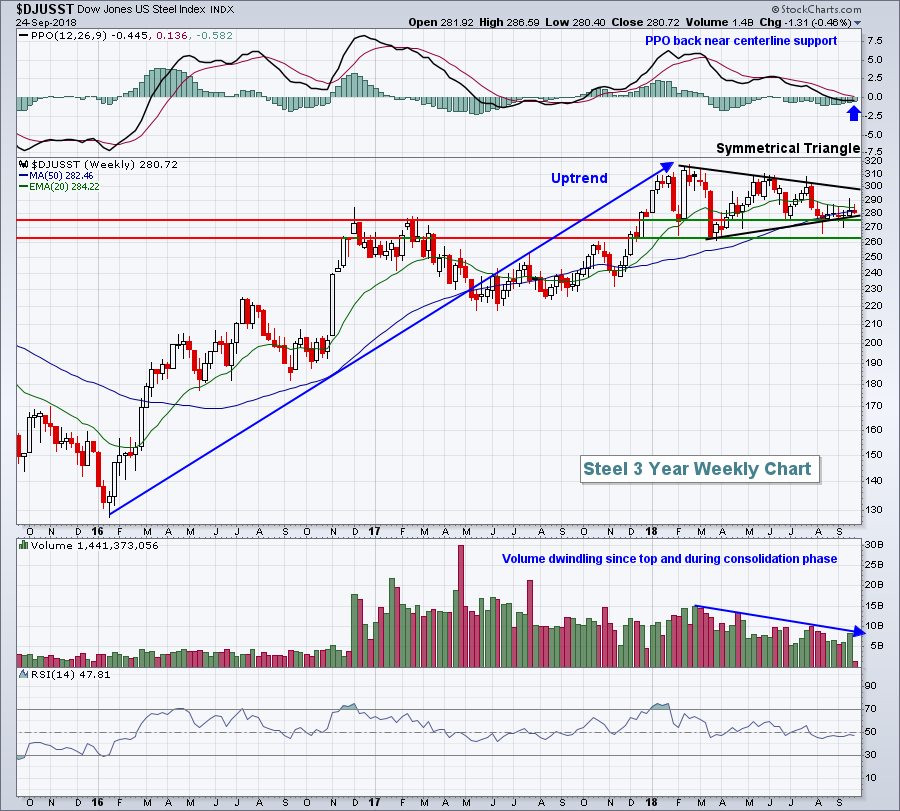
The Dow Jones U.S. Steel Index ($DJUSST) is heading into its most bullish period of the year (see Historical Tendencies section below) so it's a good time to evaluate its technical merits as we end Q3:
 A move below 260 would require re-evaluation, but otherwise the DJUSST appears poised for a rally in Q4. The weekly RSI is back in the 40s, which is exactly where it's been just prior to previous major rallies. The symmetrical triangle continuation pattern typically results in further upside action and a break above 300 would likely trigger such a rally.
Historical Tendencies
The DJUSST performs quite strongly in Q4 from a seasonal perspctive. The industry group's entire annual gain (+12.4%) has been earned in Q4 (+12.7%) over the past two decades.
Key Earnings Reports
(actual vs. estimate):
FDS: 2.20 vs 2.22
INFO: .58 vs .55
(reports after close, estimate provided):
CTAS: 1.78
NKE: .62
Key Economic Reports
FOMC meeting begins today
July Case Shiller HPI to be released at 9:00am EST: +0.1% (estimate)
July FHFA house price index to be released at 9:00am EST: +0.3% (estimate)
September consumer confidence to be released at 10:00am EST: 131.7 (estimate)
Happy trading!
Tom
