Market Recap for Thursday, September 20, 2018
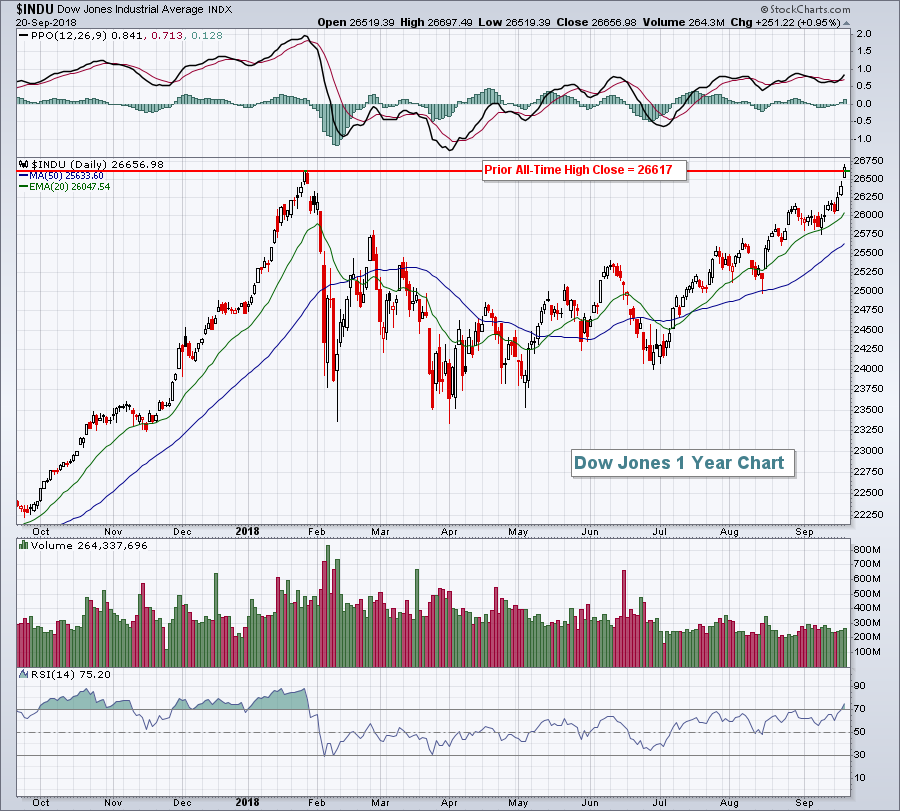
Dow Jones, welcome to the party! It's been eight months since the Dow Jones could say it closed in record all-time high territory, but that's what happened at yesterday's close. The Dow Jones joined the S&P 500, NASDAQ and Russell 2000, all of which have regularly been producing record high closes. While the NASDAQ and Russell 2000 both enjoyed gains yesterday of approximately 1%, they have more work to do to get back into record high territory. I don't believe it'll take too long, however, as we're rapidly nearing the start of quarterly earnings season and Wall Street is likely to trade higher in anticipation of solid results.
Here's the visual of the Dow Jones' breakout:
 I have good news and bad news about the Dow's likely future performance. The good news is I think it goes higher. The bad news is the recent outperformance is likely to end. I believe the Dow Jones will perform well, but I see the NASDAQ and Russell 2000 outperforming in the fourth quarter. It's not a shocker to me that the Dow's recent outperformance has been accompanied by a falling dollar. The rising dollar is one of the big reasons why the Dow Jones struggled on a relative basis throughout 2018. Need proof?
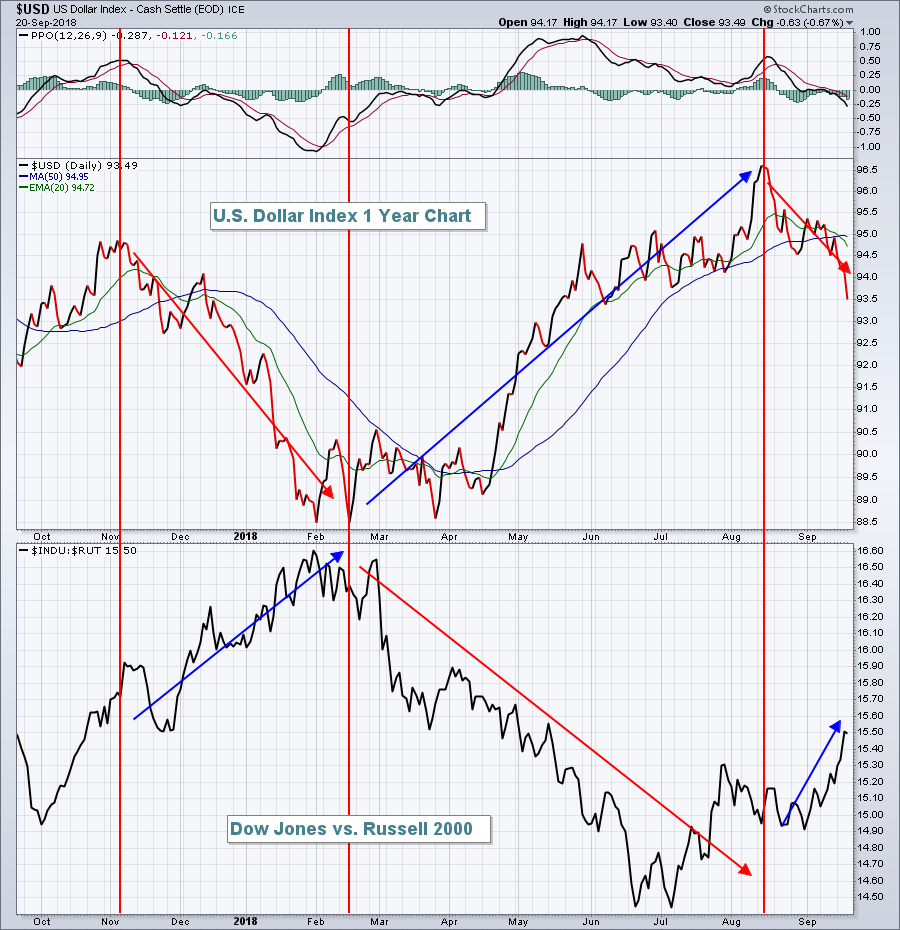 So if you're currently trying to decide how to weight your portfolio, a big consideration is what you believe the USD will do. I believe the USD will resume its upward thrust, but the question is WHEN. I look at that a bit more in the Current Outlook section below.
All nine sectors rose on Thursday and that's what we want to see when all-time highs are cleared - wide participation. That is a hallmark of a bull market and an indication that the bull market can be sustained. Consumer staples (XLP, +1.26%) and technology (XLK, +1.18%), an odd couple, were the sector leaders. I love seeing technology lead because it represents "aggressive" money that is primarily seeking growth. So long as market participants choose aggressive sectors over defensive sectors, the "risk on" attitude is likely to drive prices higher in the weeks ahead. Yes, the XLP led yesterday and it's a defensive sector, but it doesn't outperform for long during a bull market run:
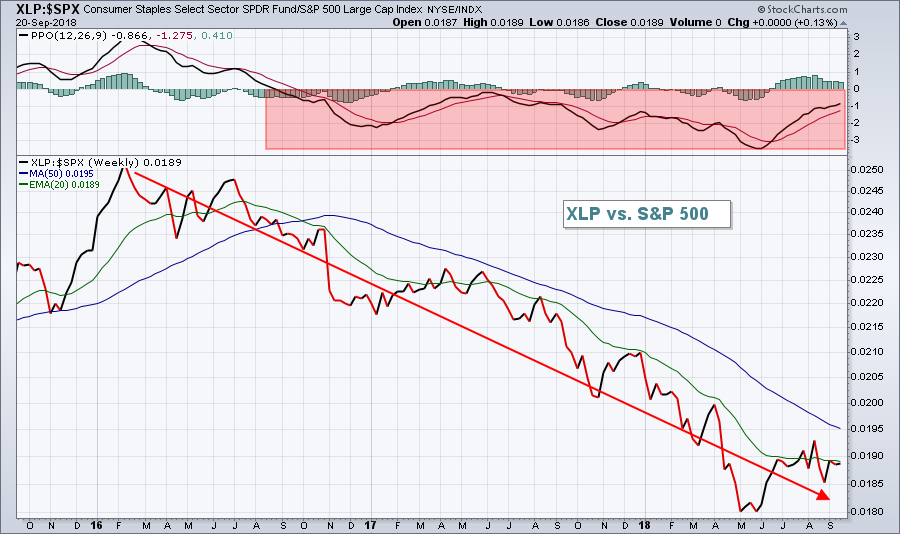 This simple chart tells us one very important thing about this bull market advance. It has legs. Defensive stocks continue to take a back seat. They're moving higher, so we have the wide participation we're looking for, but they're lagging on a relative basis as money rotates in "risk on" fashion. Unfortunately for the bears, that is "checkmate".
Pre-Market Action
Strength abroad is readily apparent. Overnight, Asian markets posted very solid gains, including the downtrodden Shanghai Composite ($SSEC), which gained 2.50%. In Europe this morning, indices are up by 0.50% to 1.00% and this overseas strength is carrying over into U.S. equities as both the Dow Jones and S&P 500 look to build on Thursday's record high closes.
With 30 minutes left to the opening bell, Dow Jones futures are higher by 55 points.
Current Outlook
The U.S. Dollar Index ($USD) broke down in the near-term yesterday, but I still believe it'll regain its strength and head towards 100. No, I'm not being stubborn. I have technical reasons for believing it. U.S. treasury yields ($UST10Y) are rising faster than German treasury yields ($DET10Y). You can see it visually by typing the symbol "$UST10Y-$DET10Y" into a SharpChart:
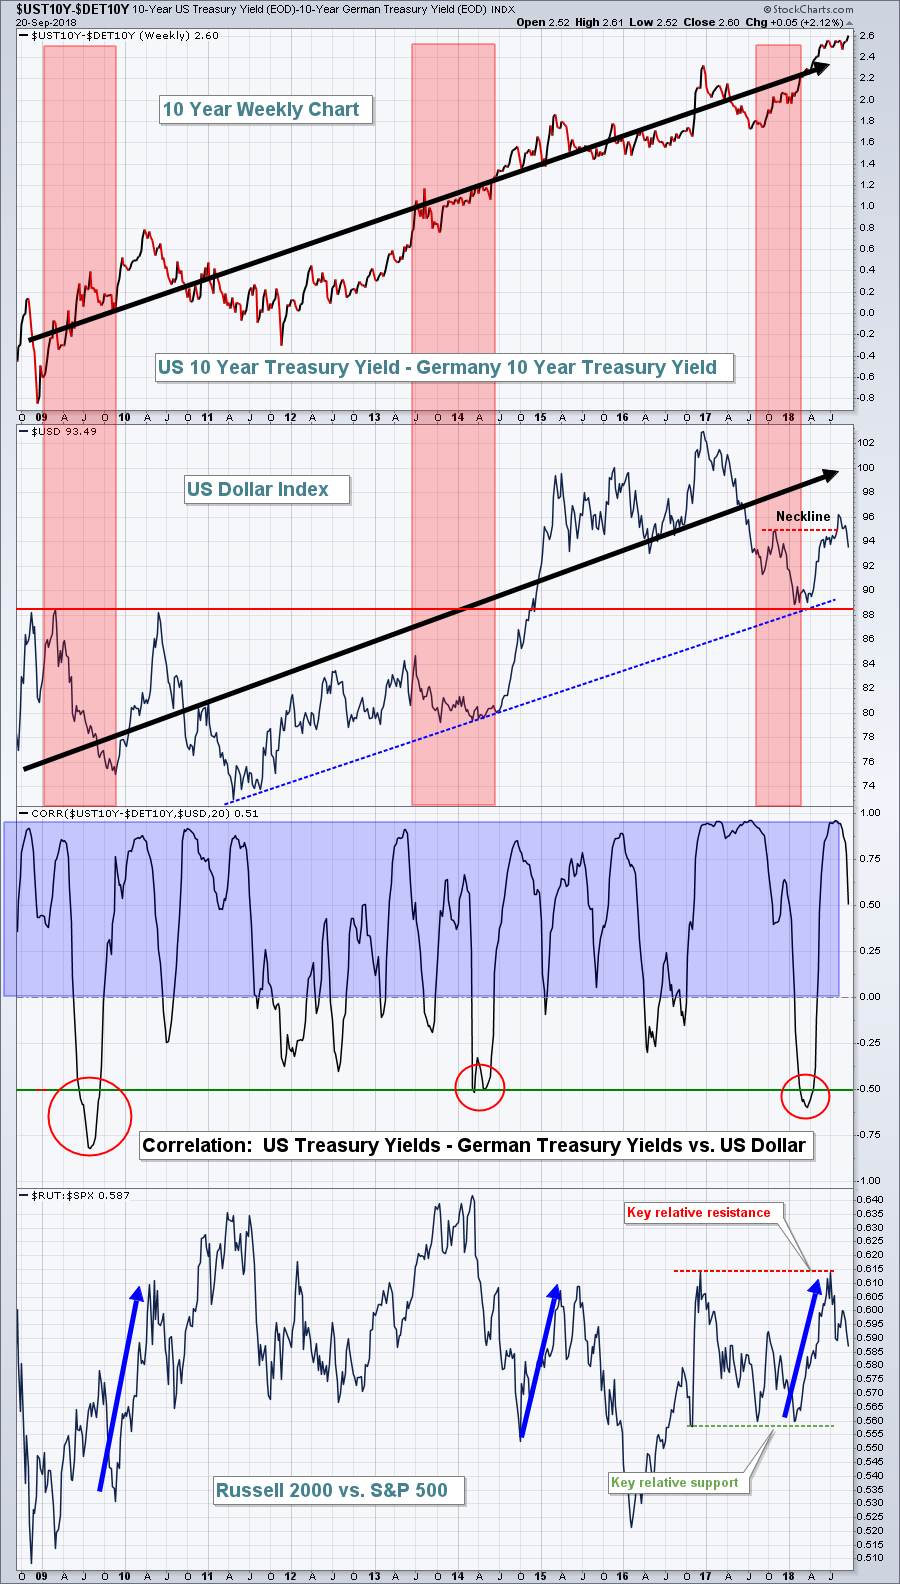 The fact that our treasury yields are rising faster than Germany's signals that bond traders believe our economy is strengthening faster as well. If the U.S. economy is growing faster than other parts of the world, our treasury yields should rise faster and our currency should strengthen as well. The correlation coefficient confirms this relationship. Over the past 10 years, this relationship has mostly held true. It's not a 100% positive correlation, but it's pretty darn strong. Recently, the UST10Y-DET10Y has moved higher while the USD has moved lower and you can see the correlation falling as a result. The reason I continue to like the NASDAQ and small caps on a relative basis is that I believe the USD will turn back higher and travel together with the UST10Y-DET10Y. I could be wrong as there have been periods of inverse correlation so we'll just have to see what happens.
Sector/Industry Watch
Existing home sales came in a bit lighter than expected yesterday and the home construction stocks ($DJUSHB) failed to participate in the bull market party on Wall Street. Not only did the group not participate, but it also closed at a fresh 2018 low. Check this out:
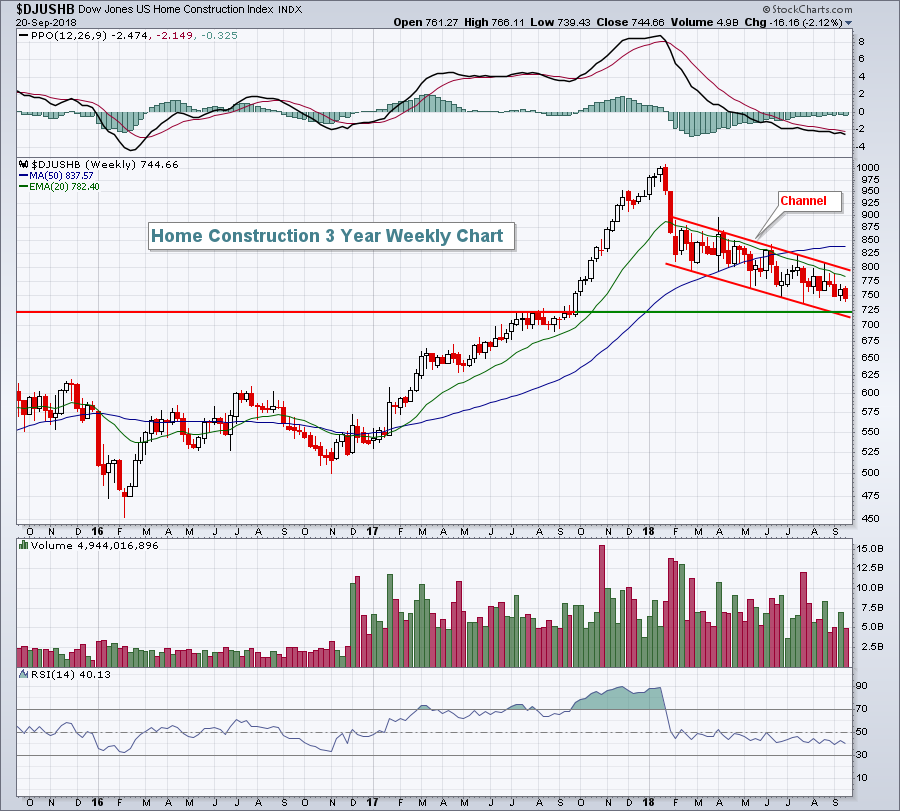 Home construction is saying "what bull market"? Steer clear of the group until the declining 20 week EMA and the current down channel are cleared. The explosion in home construction in 2017 really took place after resistance near 725 was taken out. So I'm thinking we could see a reversal near that level. But timing a bottom can be very dangerous. We've all heard of that "falling knife" theory. I prefer to see uptrending tendencies take place and bullish momentum begin to build before jumping in. For those trying to find a bottom, however, perhaps 725 will do it.
Historical Tendencies
This may come as a complete shocker to many of you, but there is only one industry group that has produced the following over the past two decades:
(1) an average annual return of >15%
(2) more than 60% of those gains in Q4
I thought about making you wait for tomorrow's blog article for the answer, but that 24 hour drum roll would be too cruel. So instead you'll just have to scroll down to the very bottom of today's article. :-)
Key Earnings Reports
None
Key Economic Reports
September PMI composite flash to be released at 9:45am EST: 55.1 (estimate)
Happy trading!
Tom
PS. Ready for the answer to today's Historical Tendencies trivia question? It's home construction ($DJUSHB). The group has averaged gaining 15.9% per year since 1999 and 62% of those gains have come in the fourth quarter. Who would've thunk the colder autumn months would produce such great results for home construction? The group has been in a funk in 2018, but if it breaks its downtrend, be prepared as the fourth quarter could be strong.
PSS. Since you've already scrolled down this far in my article, go just a little bit lower and subscribe to my blog if you haven't already. I'm going to spend the next several days highlighting historical tendencies for the fourth quarter that you won't want to miss. Simply type in your email address below and click the green "Subscribe" button and you'll begin to receive my blog articles directly in your email immediately upon publishing! Thanks so much for your support and enjoy your weekend!
