Market Recap for Thursday, June 28, 2018
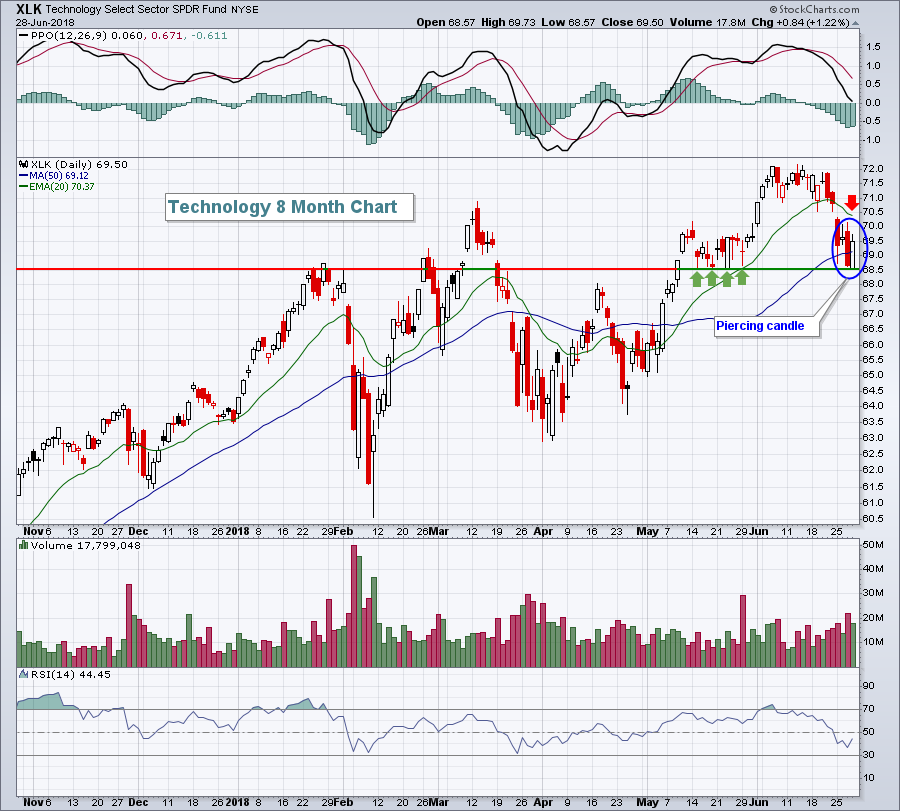
The selling episode went according to plan, with many higher risk areas taking on most of the bears' wrath. The three worst performing sectors over the past week led the rebound on Thursday. Technology (XLK, +1.22%), financials (XLF, +0.87%) and consumer discretionary (XLY, +0.79%) were the primary benefactors yesterday as the NASDAQ (+0.79%) paced the rally. The XLK printed a reversing piercing candle and now looks to move higher and perhaps test its declining 20 day EMA:
 Note that Thursday's reversal took place at price support from May (green arrows). The rebound also occurred just after the XLK printed an RSI reading of 40, which is a typical level where buyers return during uptrends.
Energy (XLE, -0.13%) was the weak link on Thursday, but it did manage to bounce nicely off an intraday 20 day EMA test.
Pre-Market Action
Nike (NKE) is soaring in pre-market action after delivering a very solid quarterly earnings report. Traders, in particular, are loving the rebound in North American sales as NKE trades up more than 10% this morning.
Dow Jones futures are showing strength, higher by 100 points 30 minutes from the opening bell.
Current Outlook
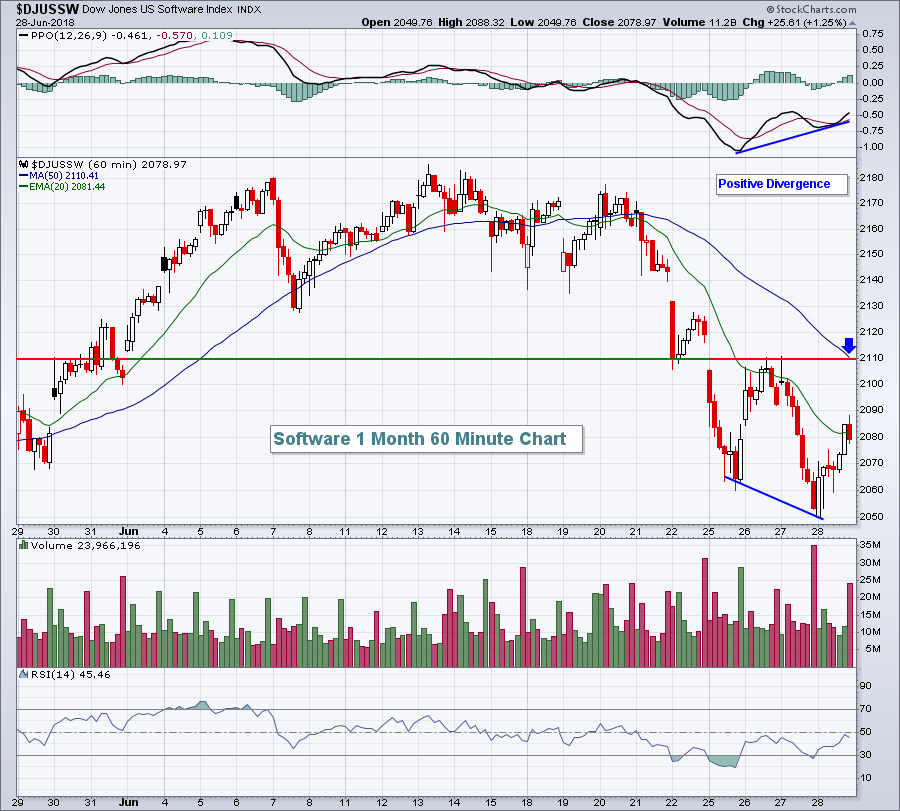
Software ($DJUSSW) has been one of the strongest industry groups since the market rallied off late-2016 lows. It's pulled back 6% or so in less than two weeks, however. The good news is that it bounced off May price support and its rising trendline support. Also, a 60 minute positive divergence printed on yesterday's lows and that's a signal of slowing short-term price momentum to the downside:
 I'd look for a minimum bounce to 2110 to test recent price resistance and the declining 50 hour SMA.
Sector/Industry Watch
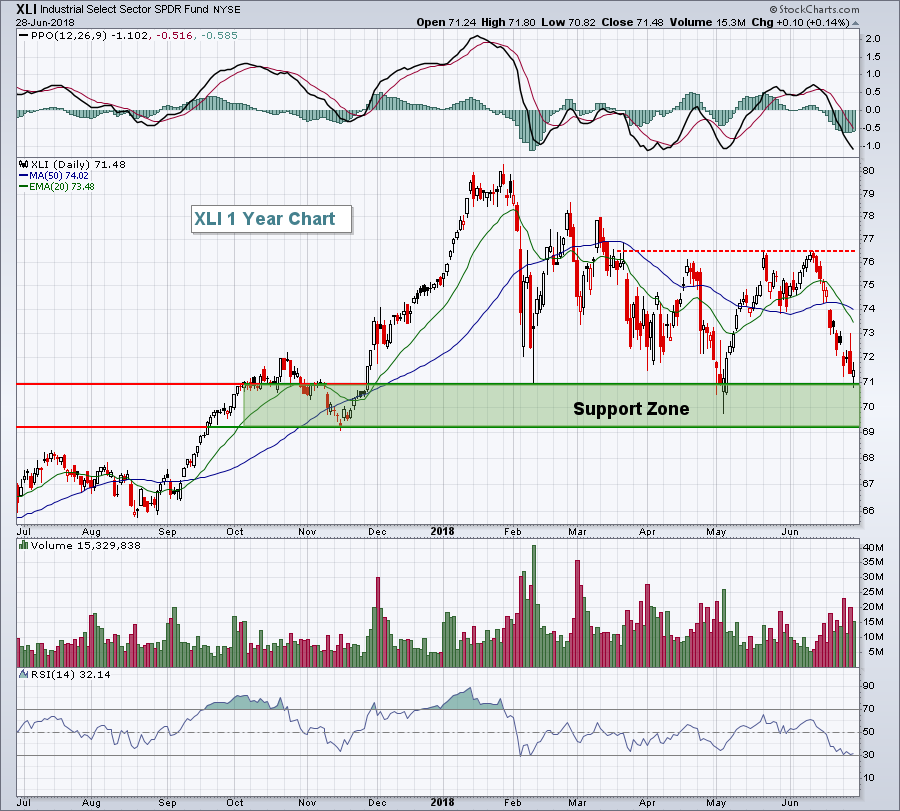
Industrials (XLI, +0.14%) were just barely positive on Thursday, but all of the recent selling sent this sector down to test key price support. I'm looking for an oversold bounce in this space:
 Recent tops leave overhead resistance at the 76.50 level, but I fully expect a move higher to test this area. The selling has created a solid reward to risk trade as the XLI is in an accumulation area from 69 to 71 - its key support in my view.
Historical Tendencies
The Russell 2000 has a history of finishing out the month of June on a very bullish note. Since 1987, the June 27th through June 30th period has produced annualized returns of +83.84%. However, in June 2018, the Russell 2000 has been down approximately 1% with just one day left in the period. Will today be a big day to follow the historical pattern?
Key Earnings Reports
(actual vs. estimate):
STZ: 2.20 vs 2.42
Key Economic Reports
May personal income released at 8:30am EST: +0.4% (actual) vs. +0.4% (estimate)
May personal spending released at 8:30am EST: +0.2% (actual) vs. +0.4% (estimate)
June Chicago PMI to be released at 9:45am EST: 60.1 (estimate)
June consumer sentiment to be released at 10:00am EST: 99.0 (estimate)
Happy trading!
Tom
