Market Recap for Monday, May 14, 2018
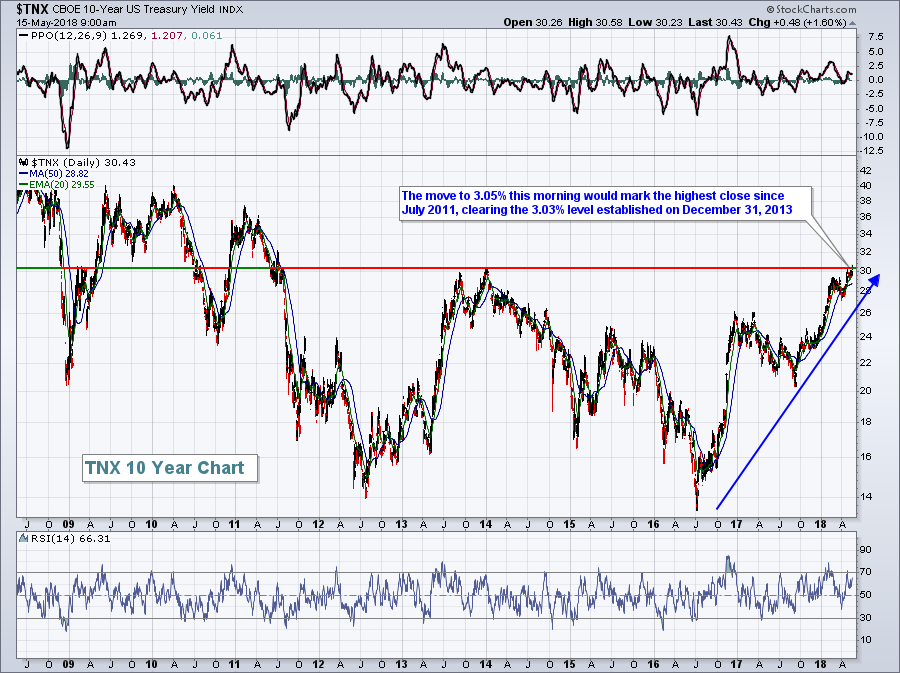
It was a day of bifurcated action, although the Dow Jones did manage to close higher for the 8th consecutive trading session, the longest such streak in 2018. One look at sector performance, however, illustrates the mixed action. Four sectors finished higher while five finished lower. On the positive side, energy (XLE, +0.69%) and healthcare (XLV, +0.66%) aided the bulls attempt to keep the rally alive. Weakness was primarily felt in utilities (XLU, -0.38%) as the 10 year treasury yield ($TNX) rose and finished near 3.0%. In early trading today, bonds are being sold off and the TNX has climbed to 3.05%. That would represent its highest close since July 2011. Here's a long-term chart of the TNX (including this morning's surge higher):
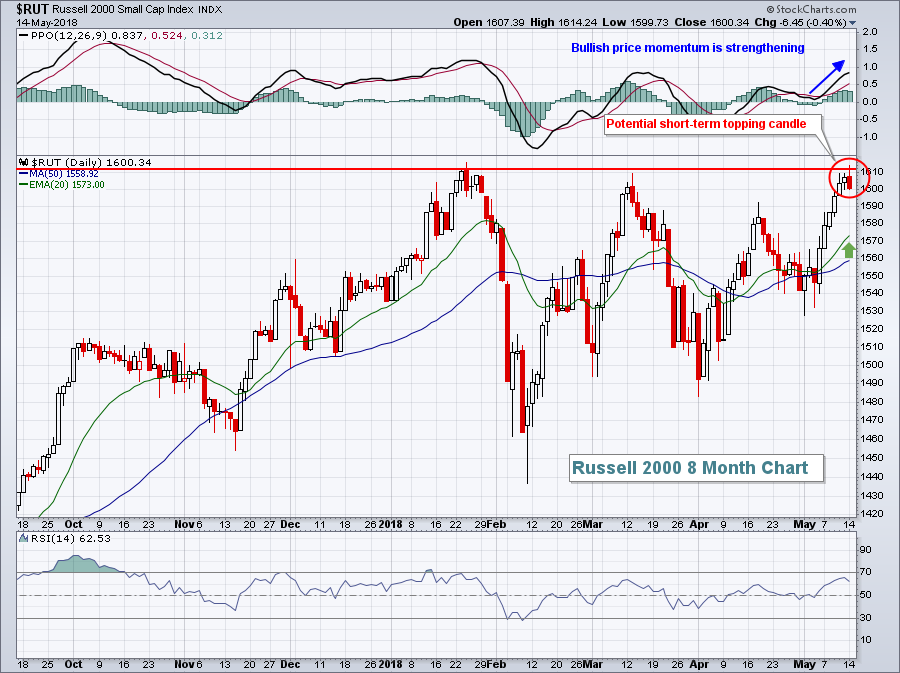
 Rising treasury yields have plenty of effects throughout the bond and stock market. I've been suggesting that the TNX would clear the 3.03% threshhold eventually and it's possibly happening today. Rates are rising faster here than in other parts of the world and that's putting a solid bid under the dollar ($USD). A rising dollar aids small caps vs. large caps and we've certainly been seeing that play out over the past 2-3 months. Yesterday, the small cap Russell 2000 index tested all-time closing high resistance before succumbing to selling pressure late in the day:
 While I'd be in favor of short-term profit taking in the IWM (ETF that tracks the Russell 2000), I'd also be quick to jump back in if we get a closing breakout. On weakness, I'd re-enter at the rising 20 day EMA. In a rising dollar environment, I believe it's prudent to have exposure to small cap stocks, perhaps even overweighting the group.
Banks ($DJUSBK), although flat on Monday, should also perform very well in a rising interest rate environment. Utilities (XLU) and REITs ($DJR) would be two areas likely to underperform in such an environment.
Pre-Market Action
The 10 year treasury yield ($TNX) is surging today to 7 year highs as it approaches 3.05%. Gold ($GOLD) is getting crushed, down $19 and beneath $1300 per ounce. Crude oil ($WTIC) is up 1% and nearing $72 per barrel. We saw mixed action in Asia overnight and European markets are mostly flat this morning.
With less than 30 minutes to today's opening bell, profit taking is kicking in on Wall Street with Dow Jones futures down 153 points at last check. The bulls will have some work to do to lead the Dow Jones to its 9th consecutive daily gain by the closing bell.
Current Outlook
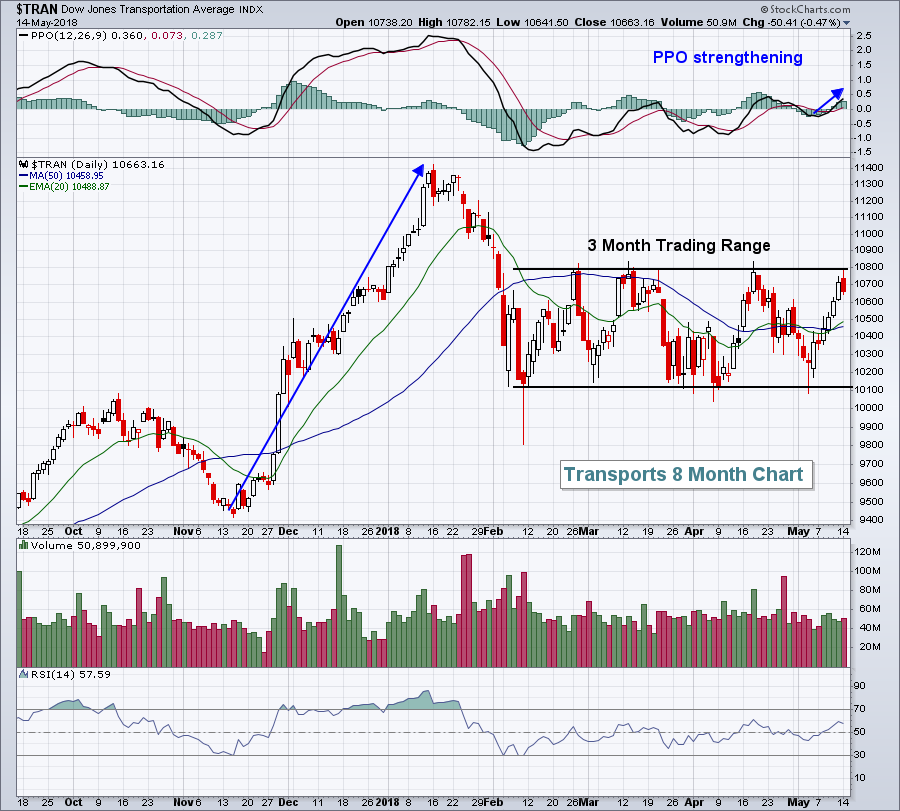
I am continuing to watch the Dow Jones Transportation Average ($TRAN) closely. Since the initial selling into early February, the TRAN has traded above 10795-10800 six times without a single close above 10800. That's clearly a critical price resistance level that, if cleared, would provide another bullish signal that the nine year old bull market is resuming:
 Similar to the last two trips to 10800, the TRAN's PPO is above zero and accelerating, but I view the PPO as a secondary indicator to the combination of price and volume. The PPO is set up nicely if we can get the price breakout.
Sector/Industry Watch
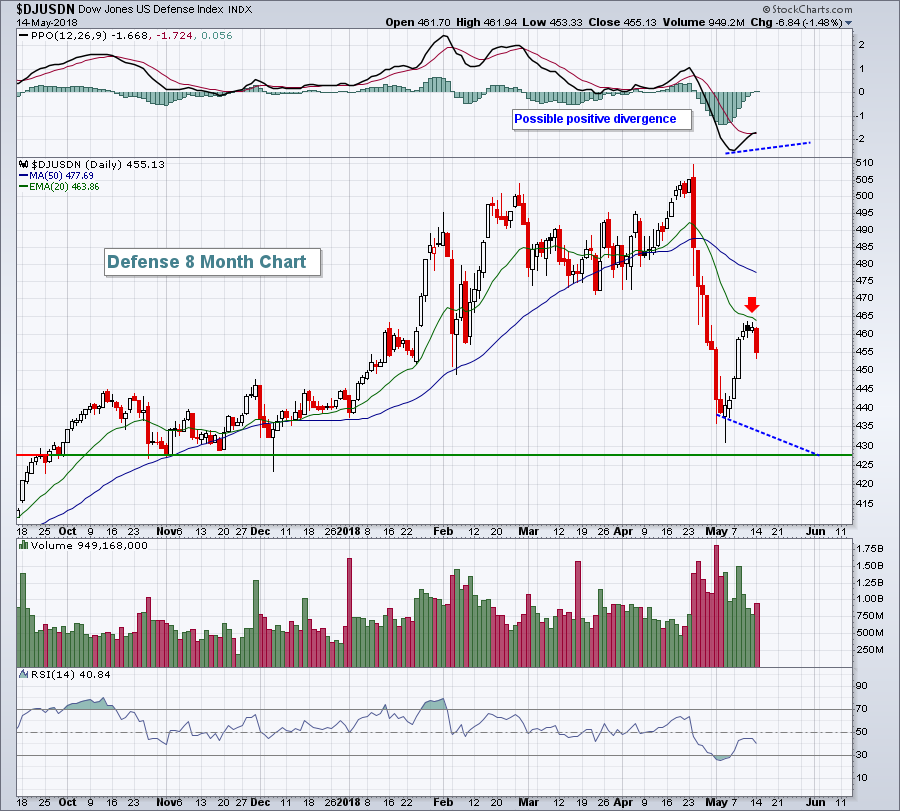
The Dow Jones U.S. Defense Index ($DJUSDN) failed in its first attempt to clear its declining 20 day EMA. Many defense stocks sold off hard after their latest quarterly earnings reports, leaving the group vulnerable to further selling. The next low could be accompanied by a higher PPO, representing a positive divergence - something to watch for:
 The 20 day EMA failure is marked with a red arrow. The blue dotted lines are provided, assuming that the DJUSDN moves to a low close beneath the early May low, perhaps down to a price support zone from 425-430. That would be a key technical level to print a significant price low. We may or may not move back down to that area, but if we do a major bottom could form.
Historical Tendencies
While May has been a fairly strong month for small cap stocks, the same cannot be said for the larger cap S&P 500 index. Since 1950, May has produced annualized returns of +2.84% on the benchmark S&P 500. That pales in comparison to its 9% average annual gain enjoyed over that period.
Key Earnings Reports
(actual vs. estimate):
HD: 2.08 vs 2.06
Key Economic Reports
April retail sales released at 8:30am EST: +0.3% (actual) vs. +0.3% (estimate)
April retail sales less autos released at 8:30am EST: +0.3% (actual) vs. +0.5% (estimate)
May empire state manufacturing survey released at 8:30am EST: 20.1 (actual) vs. 15.5 (estimate)
March business inventories to be released at 10:00am EST: +0.2% (estimate)
May housing market index to be released at 10:00am EST: 69 (estimate)
Happy trading!
Tom
