Market Recap for Wednesday, March 14, 2018
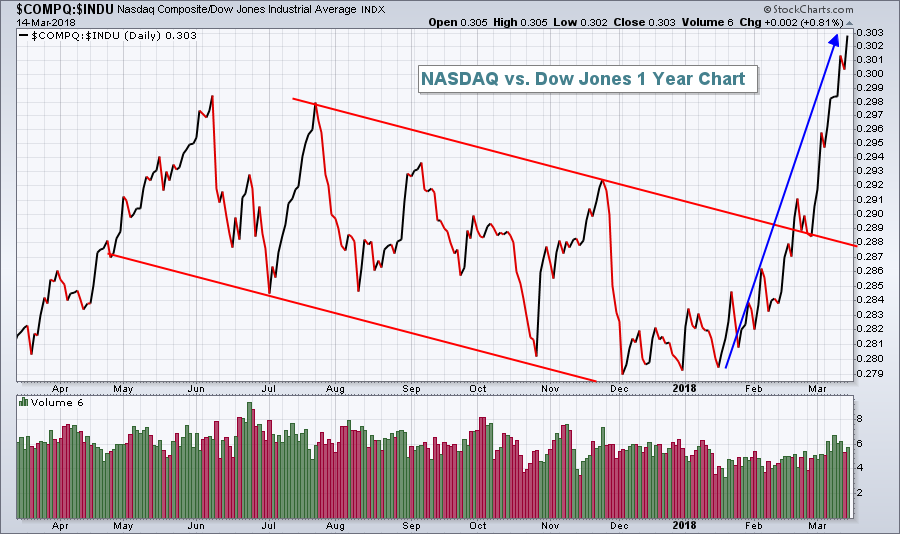
The U.S. stock market continued its bifurcated ways on Wednesday. While all of our major indices declined, it was not across-the-board selling. The Dow Jones (-1.00%) saw the brunt of the selling, while the NASDAQ Composite (-0.19%) outperformed by a mile again. A theme began two months ago and it's accelerating. Money is rotating away from the large cap behemoths found on the Dow Jones and gravitating to the tech-laden NASDAQ. Here's a visualization:
 There have been a number of reasons for this bifurcation:
(1) The large energy companies on the Dow Jones have been awful in 2018. Chevron (CVX) hit 132 in January. It's now at 115.
(2) Financial stocks have struggled since the 10 year treasury yield ($TNX) topped in early February.
(3) Many of the consumer staples stocks in the Dow Jones have lagged badly. For instance, Coca Cola (KO) was above 48 in late-January and it closed beneath 44 yesterday. Proctor & Gamble (PG) was 92 in January, but it's now at 79.
(4) Large healthcare stocks have underperformed badly. Merck (MRK) and Johnson & Johnson (JNJ) are way off their 2018 highs.
(5) Even Wal-Mart (WMT), part of the red-hot broadline retailers ($DJUSRB), can't catch a bid, falling nearly 20% in the past six weeks.
But why? What's going on? Well, the U.S. Dollar Index ($USD) bottomed in late-January and it's quite possible that many analysts projected 1st quarter earnings of these Dow components with a falling dollar in mind. I continue to expect to see the dollar to rebound strongly given the strong $UST10Y-$DET10Y uptrend. Check that out in the Current Outlook section below.
The defensive utilities sector (XLU, +1.03%) was the only sector to finish in positive territory on Wednesday. Technology (XLK, -0.09%) barely lost ground on an otherwise bearish day, enabling the NASDAQ to outperform. Four sectors fell more than 1% yesterday, including the ring leader materials (XLB, -1.23%), which suffered from selling in both aluminum ($DJUSAL, -4.16%) and steel ($DJUSST, -2.24%).
Pre-Market Action
We've seen mostly global strength in Asia (overnight) and Europe (this morning). That's carried over to the U.S., while solid economic reports this morning are not hurting either.
With 45 minutes left to the opening bell, Dow Jones futures are higher by 71 points.
Current Outlook
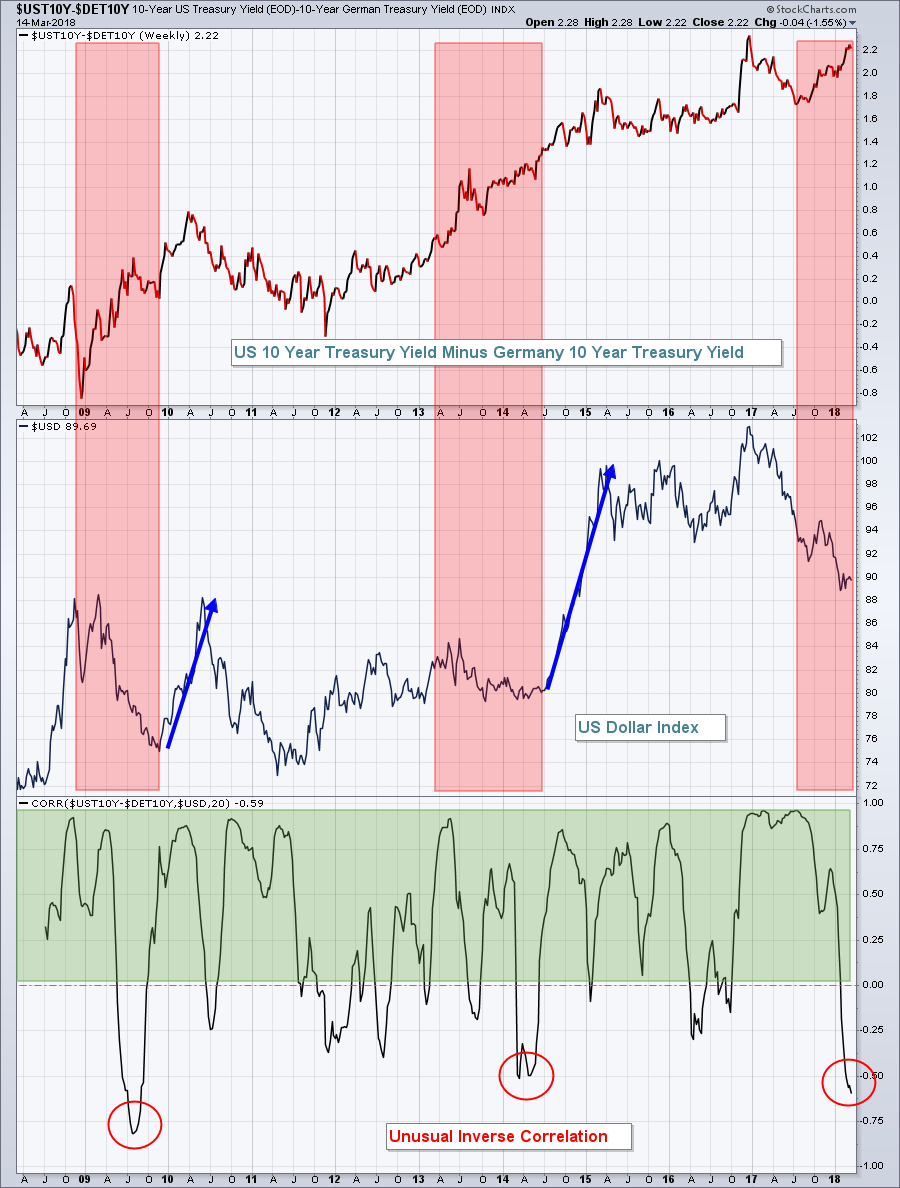
The U.S. Dollar Index ($USD) has shown a long-term propensity to follow the 10 year treasury yield ($UST10Y) relative to Germany's 10 year treasury yield ($DET10Y). But there have been times where this positive correlation has gone off track. In fact, over the past decade, it's happened three times - in 2009, 2013 and currently. After inverse relationships formed in both 2009 and 2013, the USD surged higher to play catch up. The question currently is whether that is about to occur again. If it does, it will have negative EPS consequences for many multinational companies, especially the Dow Jones component stocks. Take a look at this chart:
 The red shaded areas highlight the divergence. U.S. rates move up more rapidly than Germany, yet the dollar weakens. The red circles at the bottom illustrate the unusual inverse correlation. The blue directional lines show that the USD has caught fire the past two times this inverse correlation printed. One possible reason why the Dow Jones is underperforming so wildly in 2018 is the anticipation of a strengthening dollar later this year.
Food for thought.
Sector/Industry Watch
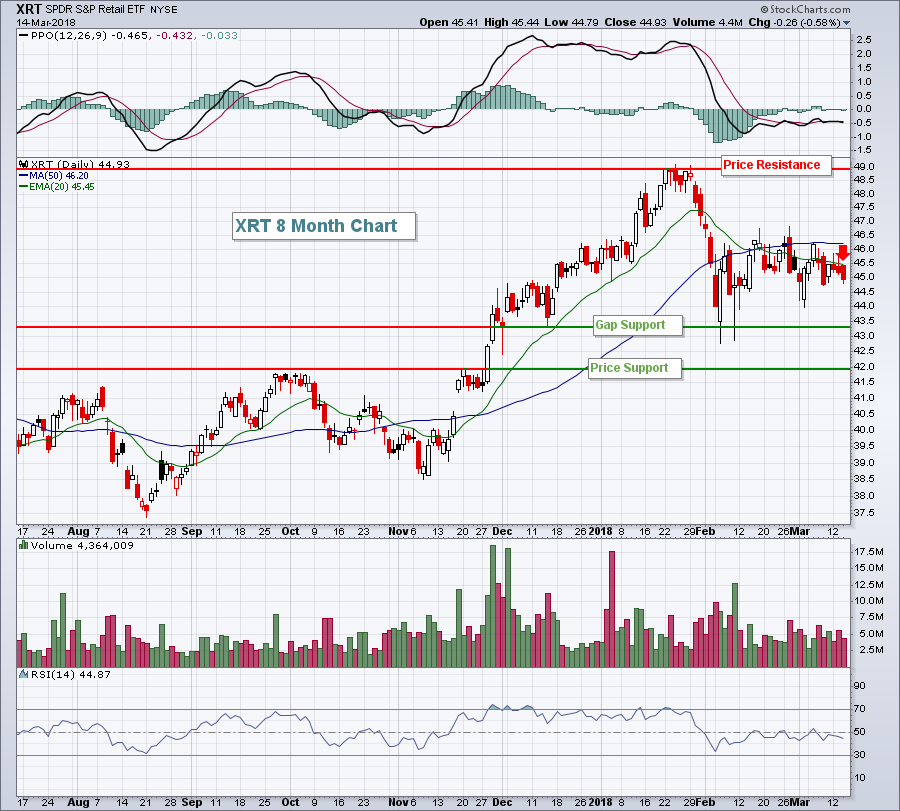
Retail sales came in weaker than expected yesterday, although much of the weakness seemed to be related to automobiles ($DJUSAU). Nonetheless, the XRT (a highly diversified retail ETF) struggled, once again failing to clear its 20 day EMA resistance:
 The chart illustrates the difficulty that retailers face in the months ahead. While consumer discretionary has been a great relative performer in terms of sector strength, and retail contributed to that relative strength, there's much work that needs to be done here to resume that strength. First and foremost, the XRT needs to close back above 46.50. That would clear key moving averages and the late-February candle body high. In my opinion, that would trigger many more technical buyers. Until then, be careful with this space and keep stops in place.
Historical Tendencies
Today marks the end to the first half of March. Historically, the S&P 500 (since 1950) has produced annualized returns as follows:
1st half of months (1st through 15th): +11.48%
2nd half of months (16th through 31st): +6.08%
Key Earnings Reports
(actual vs. estimate):
DG: 1.48 vs 1.50
(reports after close, estimate provided):
ADBE: 1.43
AVGO: 5.04
ULTA: 2.77
Key Economic Reports
Initial jobless claims released at 8:30am EST: 226,000 (actual) vs. 229,000 (estimate)
Philadelphia Fed survey released at 8:30am EST: 22.3 (actual) vs. 23.0 (estimate)
Empire state manufacturing survey released at 8:30am EST: 22.5 (actual) vs. 15.0 (estimate)
March housing market index to be released at 10:00am EST: 72 (estimate)
Happy trading!
Tom
