Market Recap for Friday, March 16, 2018
There was an industry-wide rally in energy stocks (XLE, +0.89%) on Friday and utilities (XLU, +0.88%) also performed well. The latter looks much better technically, however, as it has broken above its 50 day SMA. There's still much work to do and clearing price resistance will be Job 1:
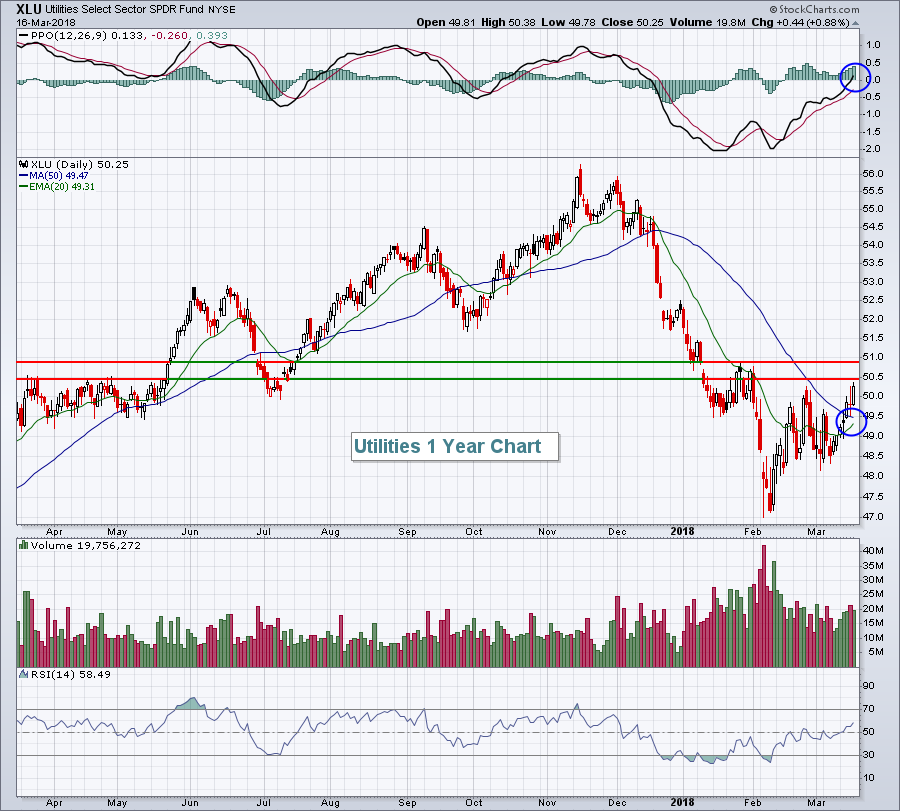 The two blue circles highlight the bullish PPO centerline crossover and the approaching golden cross where the shorter-term moving average (20 day) crosses above the longer-term moving average (50 day). These are positive developments, but overhead price resistance from 50.50-51.00 remains elusive. The XLU has a chance to outperform so long as the 10 year treasury yield ($TNX) continues to consolidate in its 2.80%-2.95% trading range. If it breaks out again above 2.95%, then I'd look for the XLU to underperform on a relative basis at a minimum, possibly even retesting recent lows.
While Friday's strength is a bit encouraging, the XLE (and most of energy's industry groups) remains technically-challenged. Integrated Oil & Gas ($DJUSOL) is a prime example of how bad things have been, and continue to be, for energy:
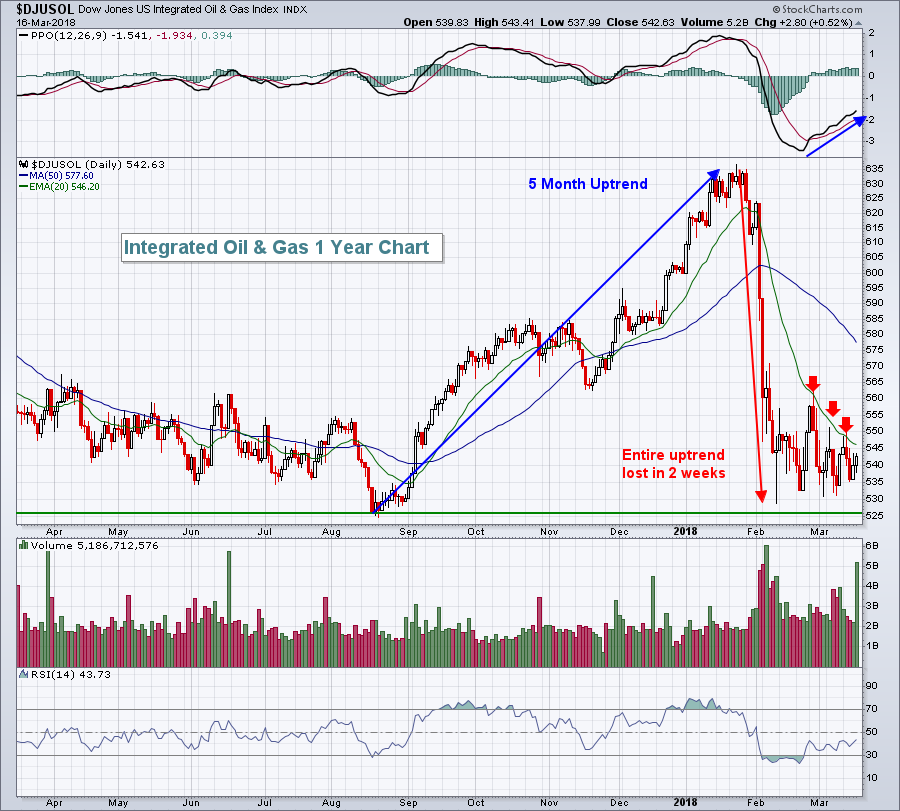 The DJUSOL lost all of its 5 month gains in just two weeks and, unlike much of the market, has failed to rebound. The red arrows show that the declining 20 day EMA has been significant resistance. Don't look for any meaningful rally in energy until 20 day EMAs are cleared.
Industrials (XLI, +0.53%) was the only other sector showing much strength as five of its sixteen industry groups finished with gains of 1% or more, including industrial suppliers ($DJUSDS), which is featured below in the Sector/Industry Watch section.
Pre-Market Action
The 10 year treasury yield ($TNX) is climbing once again this morning and is now back to 2.88%. Last week, if you recall, the TNX fell back to test the bottom of its 2.80%-2.95% trading range. Gold ($GOLD) is down fractionally and moving closer and closer to key support near $1300.
Asia began the week mixed, but Europe is decidedly lower with the German DAX ($DAX) down close to 100 points at last check. In the U.S., Dow Jones futures look to get off to a rough start, down 110 points with 50 minutes left to the opening bell.
Current Outlook
In the very near-term, the NASDAQ Composite is trying to hang onto gap support created by the huge jobs report on Friday, March 9th. The top of gap support was tested late last week with the gap support zone from 7428-7476 as reflected below:
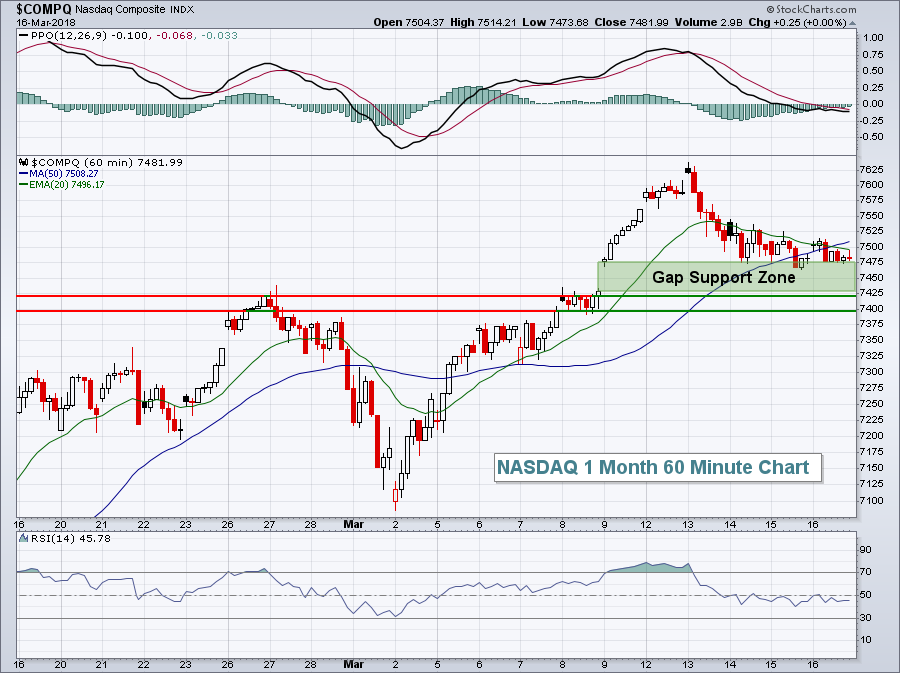 Beneath gap support is a couple levels of price support between roughly 7400-7425. Selling could accelerate if both of these price support levels are lost. Otherwise, I'd look for more accumulation during this latest period of weakness. Historically, the 19th to the 25th is the worst week of the calendar month. More on that below in Historical Tendencies.
Sector/Industry Watch
The Dow Jones U.S. Industrial Suppliers Index ($DJUSDS) gained 1.68% on Friday to approach a key resistance level and continue its overall uptrend. The group looks quite bullish and, ultimately, a breakout above the 315-320 resistance area would confirm the next leg of its uptrend:
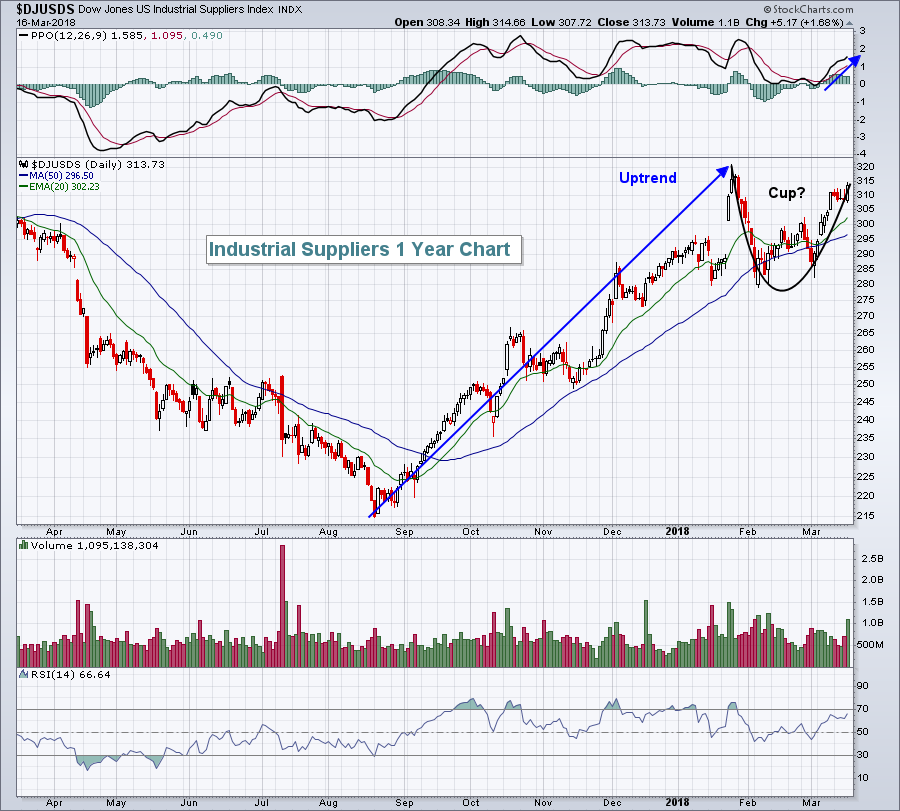 A move slightly higher to test the late-January high, followed by a pullback to the rising 20 day EMA would complete a bullish cup with handle formation that, upon a high volume breakout, would measure to the 360 area.
Monday Setups
Every Monday, I provide a number of trade setups for the week. One is featured here in this article while the others can be found by CLICKING HERE.
This week I want to feature Guidewire Software (GWRE). It's part of a very strong software space and GWRE recently reported quarterly results that blew away Wall Street's consensus estimates. Revenues were reported at $193.79 million, well ahead of $154.27 million estimates, and EPS of $.33 easily topped forecasts of $.19. The initial Wall Street reaction was bullish with GWRE gapping up and finishing solidly higher on very strong volume. Since then, however, GWRE has been declining and on Friday filled gap support and tested its rising 20 day EMA. There's still the possibility of a bit more downside to price support, but I like the reward to risk on this decline. Here's the chart:
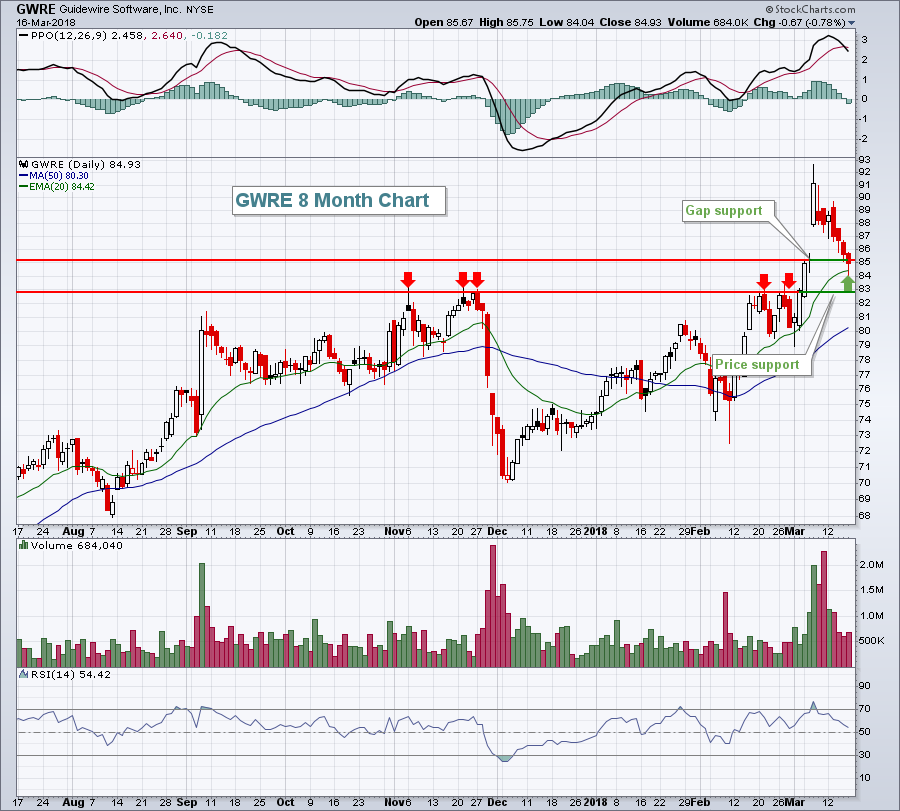 Entry from the current price down to 83 makes sense with a closing stop beneath 82.50 or so. A target of 91 could be considered.
Historical Tendencies
Since 1971, there's not been a worse period for NASDAQ stocks than the 19th through the 25th. Over the past 47 years, this 7 day period (of all calendar months, not just March) has produced annualized returns of -5.37%. This encompasses 2,692 trading days, or the equivalent of more than 10 years worth of data.
The 19th and 20th are the two worst days of the period, with annualized returns of -28.27% and -30.74%, respectively, since 1971.
Key Earnings Reports
(reports after close, estimate provided):
ORCL: .72
Key Economic Reports
None
Happy trading!
Tom
