Market Recap for Thursday, February 15, 2018
Selling is inevitable during bull markets. After each leg higher, there's typically a period of selling/consolidation. The bulls were spoiled for several months, as the bull market advance continued nearly uninterrupted. There really hadn't been any notable selling or consolidation since the August 2016 high. From there, the S&P 500 fell 5% over the next three months with the Volatility Index ($VIX), at its high, reaching 23 or so. Since that November 2016 low, the rally has been fairly steady and the VIX never pierced 17 on a closing basis - until the past few weeks. The bull market is finally seeing a test.
As I said, the selling is inevitable. We knew it would occur, it was only a matter of time. But I don't look at the selling to evaluate the strength of a bull market. I look at what happens after the selling occurs. In other words, how strongly does the market rally? Where does the money flow during that rally? Do traders still have a "risk on" mentality? Because that's what is required to extend this 9 year bull market. As I look back at the 5 day rally, a few things stand out. First and foremost, leadership the past five trading sessions is exactly what I would want to see. We know the major indices have rallied, but what's been leading?
Techology (XLK): +8.50%
Financials (XLF): +6.85%
Industrials (XLI): +5.82%
Materials (XLB): +5.71%
Consumer Discretionary (XLY): +5.13%
That's a bullish leaderboard. That's very good news. Traders are not seeking shelter in defensive-oriented sectors.
Now for the bad news....
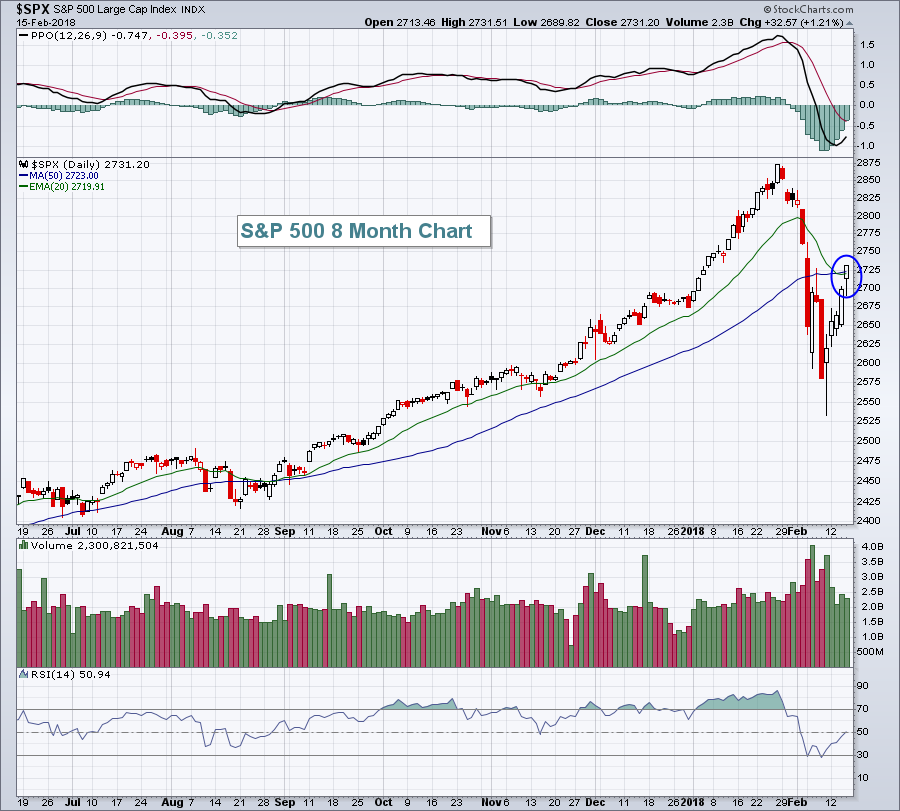
Yesterday's action saw leadership from defensive areas of the market, suggesting to me that traders are growing a bit more nervous about the short-term rally. Utilities (XLU) was Thursday's leader, gaining 2.22%. Technology also remained strong, rising another 1.91%, but in 3rd place was consumer staples (XLP), a much more defensive-oriented area of the market, climbing 1.65%. On the surface, we saw one very bullish technical development as all of our major indices cleared their now-declining 20 day EMAs. That's important because it's impossible to have an extended uptrend beneath the 20 day EMA so this breakout was a necessary component to resuming the bull market. Here's a quick look at the S&P 500 after yesterday's surge:
 The blue circle highlights yesterday's action where we saw the S&P 500 close on its high of the day and above both its 20 and 50 day moving averages.
Pre-Market Action
U.S. futures are near the flat line as we approach a new trading day, the final day of a very bullish week thus far. Housing starts and building permits came in much better than expected and that could lift the housing group in particular and consumer discretionary in general.
Crude oil ($WTIC) is flat this morning, but it is now 2 bucks above key price support at $59 per barrel.
Global markets are higher - in Asia last night and in Europe this morning.
Current Outlook
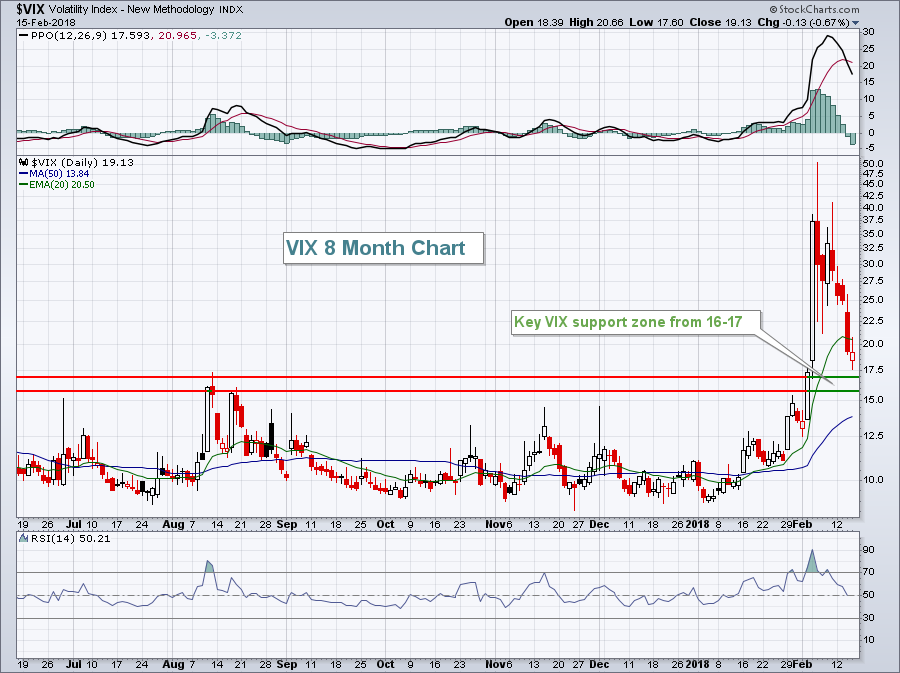
If you've been afraid to test the waters during these past few weeks of turbulence and are still considering entry, is now the time? Well, that's a really difficult question to provide a blanket answer to. It depends on a lot of things, but particularly your own risk tolerance, when you'll need the money that you're investing/trading, your trading style and strategy, among others. I will say this. We can debate back and forth what caused the selling from the recent top. Some will argue that it was simply waaaay overdue based on nearly every momentum indicator, that this was nothing more than a technical correction. Others would argue fundamental reasons - higher interest rates, inflationary pressures accelerating, debt levels, etc. Those are the "why's" that, quite honestly, I couldn't care less about. I'm a technician, first and foremost, so I believe all the fundamentals are baked into the price so the charts are where we need to focus. We are in an uptrend with nearly every "below the surface" measure flashing bullish signs in my view. I am bullish and have very little thoughts of this being the start of a bear market. But I also recognize that one ingredient of a bear market - fear (think VIX) - is prevalent and must be considered. During each of the past two bear markets, they started with a VIX reading above the 16-17 level and never retreated beneath this level during the entire bear market. And it makes sense to me because fear generates the selling and resets everyone's mentality to sell the rallies.
We just saw the VIX hit 50, a very high reading on a historical basis. The 40-50 level on the VIX normally results in capitulation and I think it's pretty clear that it just did it again. During the current five day rally, the VIX has been falling rapidly. Yesterday's low was 17.60. And traders reacted by moving into defensive areas of the market, namely utilities and consumer staples (1st and 3rd best sector performers yesterday as mentioned earlier). If I've watched the last five days from the sidelines, I think I'd have to at least wait to see if the VIX settles back down beneath 16.....and then slowly invest over the next 3-6 weeks in the event we do see further selling. Check out the VIX:
 If we're going to see another fear-driven selloff, I'd expect it very soon. I've said since this selloff began that I'm looking for a bullish continuation pattern to develop - some sort of triangle, cup, maybe bullish wedge. The wedge would require a slightly lower close than what we saw during the last bout of selling, perhaps with a much lower VIX reading - a positive divergence of sorts.
Let me be clear. All signals point to a resumption of the bull market in time. But how we get there has infinite possibilities. Preparing for those possibilities is our next step and preserving cash during what could be back and forth action will be paramount. To that end, I sold half of every stock and ETF that I bought on last week's reversal and will sell the other half on any sign that another period of selling has begun (ie, intraday lows beneath prior day, reversing candles, etc.).
Sector/Industry Watch
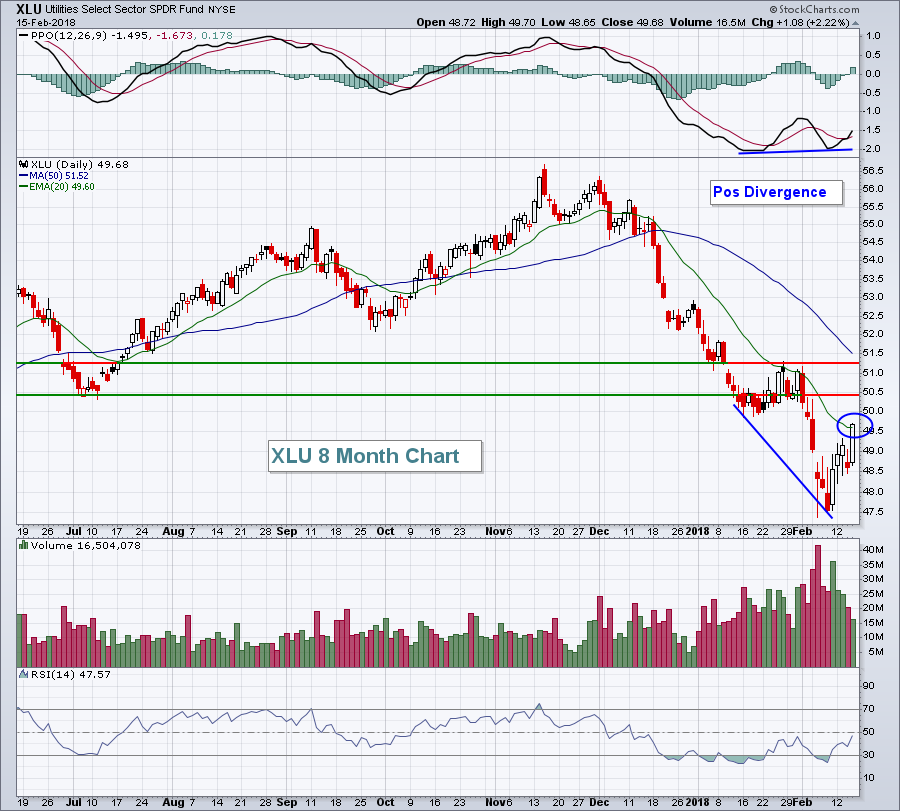
Utilities (XLU) broke above its 20 day EMA with a positive divergence in play. I'd expect to see further price appreciation to the 51.00 area to test the 50 day SMA:
 We haven't discussed positive divergences much because they rarely develop in uptrending markets. But the extreme weakness in utilities while the 10 year treasury yield ($TNX) has been surging has created a positive divergence. The break yesterday above the declining 20 day EMA (blue circle) suggests that the odds have increased that we'll see further strength and a 50 day SMA test. I'd look for it to occur somewhere between 50.50-51.25.
Historical Tendencies
Yesterday, I indicated that the NASDAQ would begin a bearish historical period today. From February 16th through February 22nd, the NASDAQ has produced annualized returns of -29.59% since 1971. To add to that historical bearishness, the S&P 500 has produced annualized returns of -15.37% since 1950. The Russell 2000 has a similar historical bearish period, but it starts and ends one day later - from February 17th through the 23rd. During this period, the Russell 2000 has produced annualized returns of -43.55% since 1987.
This does not suggest that I'm providing some sort of guarantee that the U.S. stock market is heading lower over the next week. I'm simply highlighting a historical fact and tendency, one more indication that our current rally might face headwinds today and next week.
Key Earnings Reports
(actual vs. estimate):
CPB: 1.00 vs .81
DE: 1.31 vs 1.16
IPGP: 1.86 vs 1.72
KHC: .90 vs .96
KO: .39 vs .38
NWL: .68 vs .67
SJM: 2.50 vs 2.16
VFC: 1.01 vs 1.02
VMC: .74 vs .72
Key Economic Reports
January housing starts released at 8:30am EST: 1,326,000 (actual) vs. 1,232,000 (estimate)
January building permits released at 8:30am EST: 1,396,000 (actual) vs. 1,300,000 (estimate)
February consumer sentiment to be released at 10:00am EST: 95.5 (estimate)
Happy trading!
Tom
