Market Recap for Friday, January 19, 2018
Strength resumed on Friday, with three of our four major indices closing at record highs. Only the Dow Jones managed to come up short as losses in Dow components IBM, General Electric (GE) and American Express (AXP) held back the index, although it too managed to finish in higher territory, just not record high territory. Nike (NKE) soared more than 4% on Friday to lead the Dow Jones.
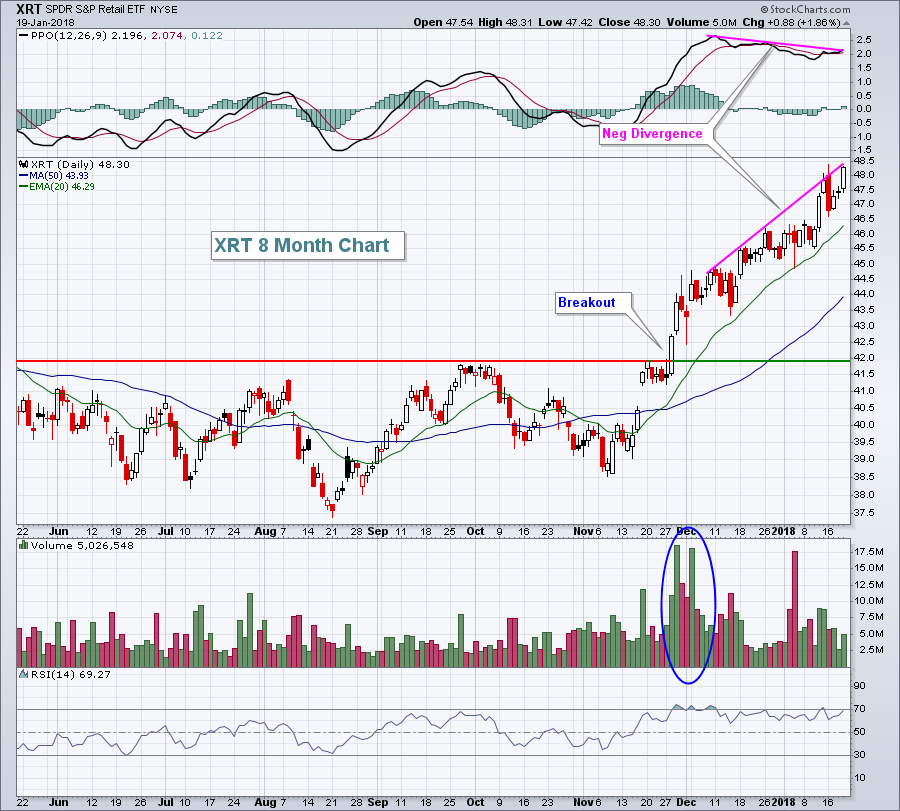
The S&P 500 was lifted mostly by retailers. One look at the top performing S&P 500 stocks from Friday and you'll see a plethora of retail or retail-related stocks. The SPDR S&P Retail ETF (XRT) broke to new highs, despite a negative divergence. Momentum is improving here, however, so this negative divergence may lose its luster:
The breakout in late November was accompanied by very strong volume and the trend in retail is clearly higher. That's been huge for the consumer discretionary sector (XLY, +0.87%), which posted another solid day on Friday. In fact, the only group to perform better than discretionary on Friday was its consumer counterpart - staples (XLP, +1.12%). Consumer stocks rallying the entire market is a good thing and retail's best seasonal period - February through April - has yet to arrive.
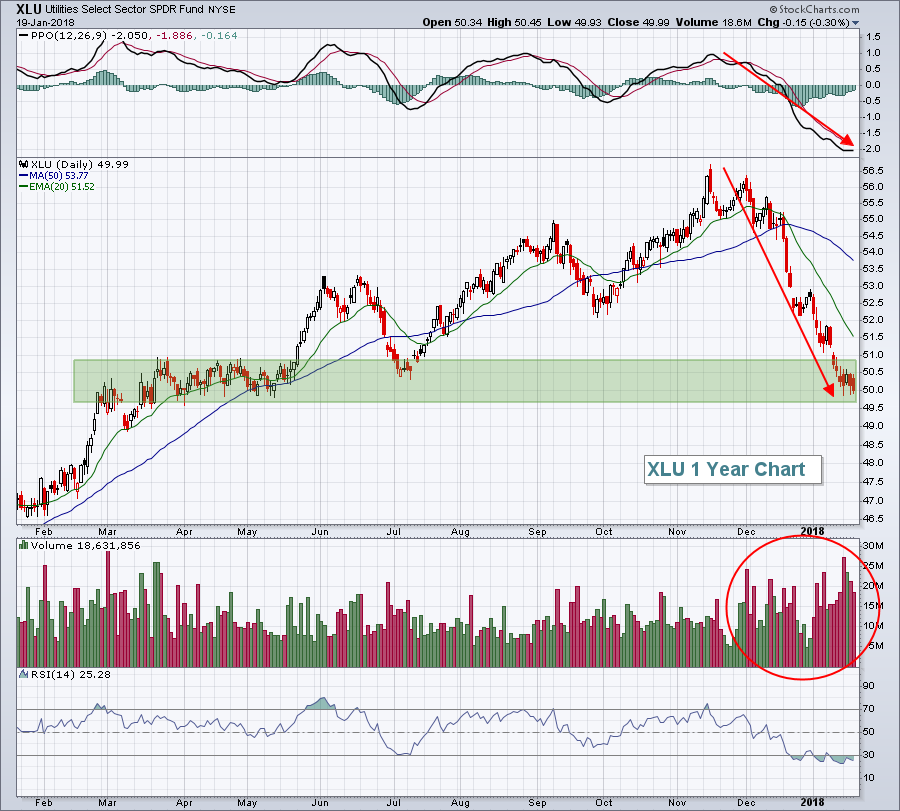
Utilities (XLU, -0.30%) was the weakest sector again, but that group has been trying to find a bottom near fairly significant price support. More on that in the Sector/Industry Watch section below.
Pre-Market Action
Asian stocks were slightly higher overnight and that strength is carrying over into Europe this morning. The 10 year treasury yield ($TNX) is now above 2.65%, rising a bit more than 1 basis point this morning. That should continue to shine a positive light on financials, especially banks ($DJUSBK) and life insurance ($DJUSIL).
With an hour until the opening bell, Dow Jones futures are lower by 50 points, with smaller losses in S&P 500 and NASDAQ futures.
Current Outlook
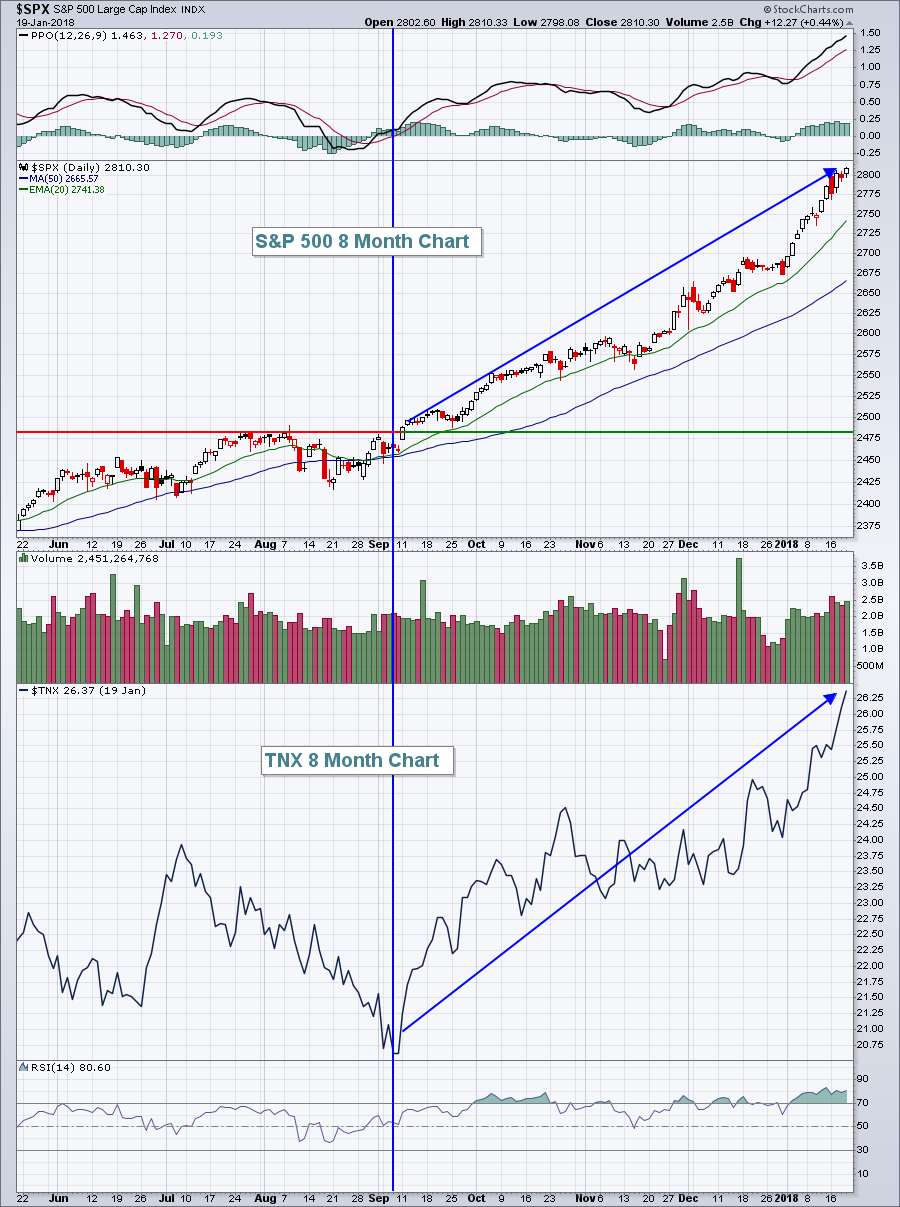
The action in the bond market was quite telling on Friday. For the first time since mid-2014, the 10 year treasury yield ($TNX) has topped 2.65%. It's an indication that the bond market believes the U.S. economy is strengthening and with interest rates still not that far from historical lows, the environment is such that profits could begin to soar and the U.S. stock market appears to be pricing in that likelihood, or at least potential. A rising TNX is synonymous with a rising S&P 500 and the two have been rising together since September. Here's the chart to illustrate it:
 This strong positive correlation is not unusual at all. In fact, when the TNX goes on a tear like this, the S&P 500 typically goes right along with it. That's why the TNX moving to a 3 1/2 year high is a big, big deal.
Sector/Industry Watch
Given the rising treasury yields, the utilities sector can't seem to find a bottom to its downtrend. It is testing very solid price support now, though, so it might be worth considering at least a small position (if you trade ETFs primarily) with a tight stop:
 Let's be clear. The XLU is, by far, the weakest of the sectors right now, but it's testing a fairly significant area of price support. I'd expect to see a bounce, even if it's just temporary. I'd be careful on a close below 49.50, so a tight stop could be used to protect against continuing downside action. Those red directional lines are quite clear - the XLU is in a downtrend and the price momentum continues to accelerate. If the XLU bounces, look for resistance at the declining 20 day EMA.
Monday Setups
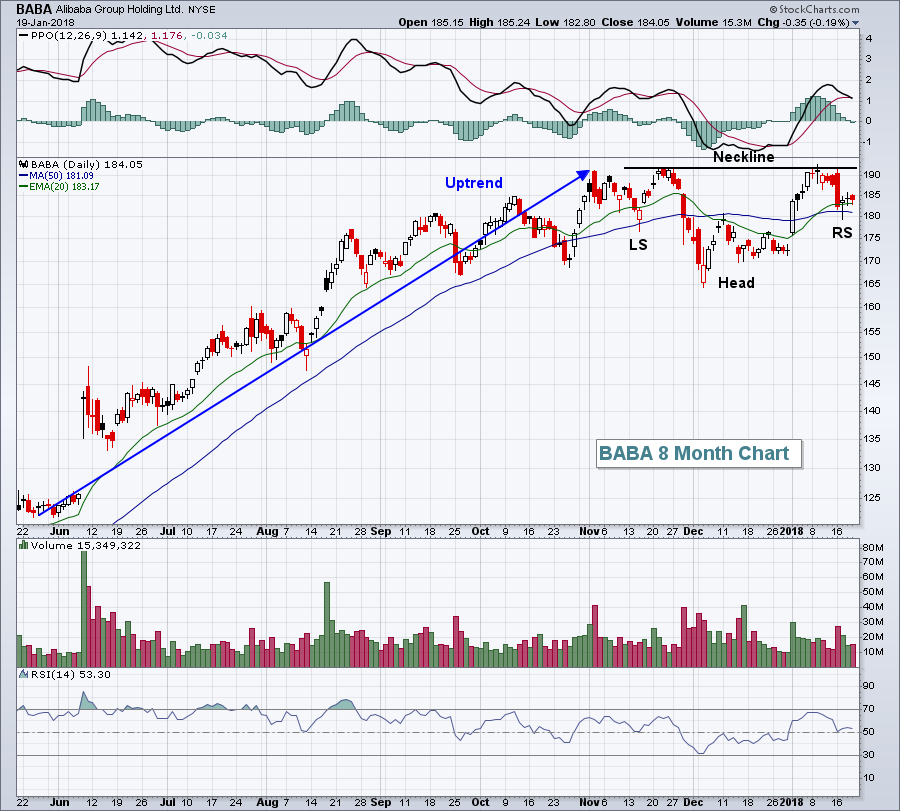
I provide several trade setups at the beginning of each week and this week's can be found HERE. I'd like to highlight one of those stocks in particular, however. Alibaba Group Holding (BABA) was in a steady trend higher throughout 2017, but has more recently been consolidating in a bullish inverse head & shoulders continuation pattern. The expectation is that this pattern will resolve itself to the upside. Check out the chart:
 Upon breakout on heavier than normal volume (close above 192), this bullish pattern would measure 27 points (depth from neckline down to inverse head). Thus, a breakout above 192 would measure to a target of 219. To the downside, a potential stop could be set on any drop beneath the inverse right shoulder low near 179. From the current price of 184.05, that would represent a very solid reward to risk ratio of 7:1 (potential reward of 35 bucks divided by potential loss of 5 bucks).
There is one word of caution here. BABA has a negative divergence on its weekly chart, so a breakdown on the daily chart should be respected.
Historical Tendencies
Since 1987, the small cap Russell 2000 index ($RUT) has produced double digit annualized returns for every calendar month from November through May, except January (+7.13%). On the other hand, it's produced single digit returns, or negative returns, for every calendar month from June through October.
Key Earnings Reports
(actual vs. estimate):
HAL: .53 vs .46
(reports after close, estimate provided):
AMTD: .51
NFLX: .41
RMD: .78
STLD: .49
ZION: .73
Key Economic Reports
None
Happy trading!
Tom

