Market Recap for Wednesday, January 3, 2018
We're only two trading days into 2018 and already we've seen the S&P 500's first close ever over 2500, the NASDAQ's first close ever above 7000, the Russell 2000's first close ever above 1550. Dow, where art thou? Well, the Dow Jones may need another day before exceeding 25,000 for the first time ever. Let's give the Dow a little wiggle room. After all, the Dow surged past 22,000 in September, 23,000 in October and 24,000 in November. That index missed the thousand point train in December, but looks to make up for it early in 2018.
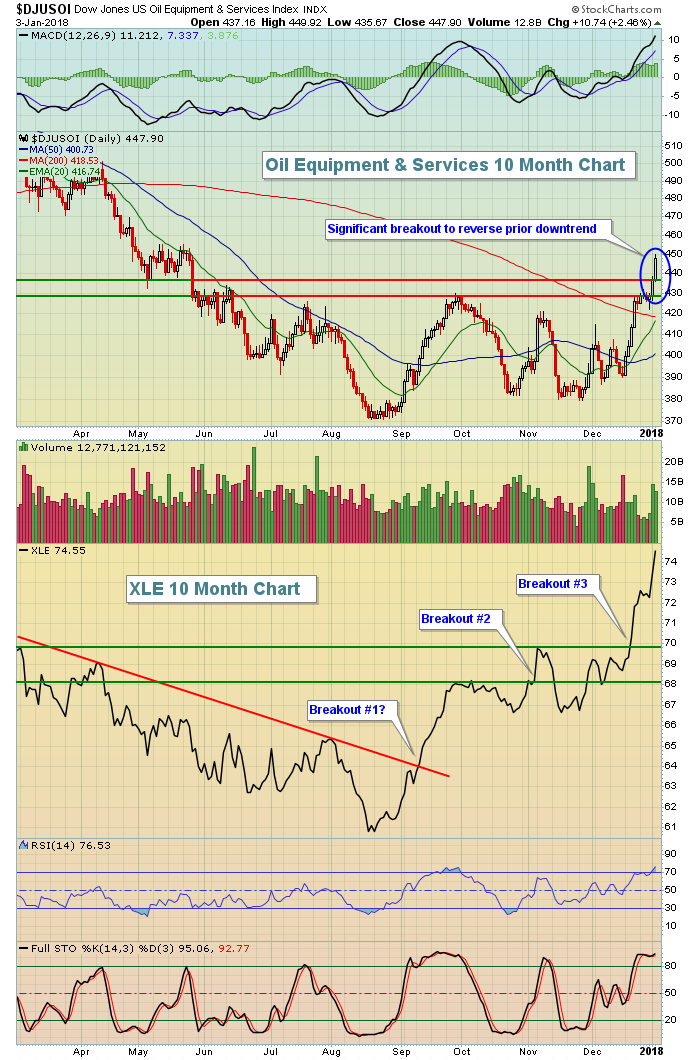
Energy (XLE, +1.50%) is absolutely on fire. The fundamentalists will begin to figure out why when the first quarter earnings reports roll in, estimates are crushed and forecasts are revised upward. Technical analysis is the study of price action to draw conclusions about fundamentals long before they're reported. The charts are already telling the technicians exactly that. While we can argue that various key breakouts on the XLE ended the group's lengthy downtrend, there's no doubt that one industry group within energy - the Dow Jones U.S. Oil Equipment & Services Index ($DJUSOI) - is just now seeing its first significant breakout to end its downtrend. Take a look:
 As more and more industry groups breakout, the relative strength of the sector accelerates. The XLE looks very strong as we move into 2018 and I expect that strength to continue.
Healthcare (XLV, +0.96%) was the second best performing sector on Wednesday and biotechs ($DJUSBT) was a primary reason. Biotechs have broken out again and are featured in the Sector/Industry Watch section below.
For the second straight session, utilities (XLU, -0.79%) and consumer staples (XLP, -0.04%), two defensive sectors, were the only sectors to finish in negative territory. Clearly, money is rotating out of defensive areas to fuel this market advance and that's generally a bullish sign.
Pre-Market Action
U.S. futures are very strong this morning on the heels of better than expected ADP employment data. Global markets have rallied and Dow Jones futures are suggesting the U.S. will follow the world. With just 30 minutes left to the opening bell, Dow Jones futures are higher by 108 points, looking to clear that psychological 25,000 level.
Current Outlook
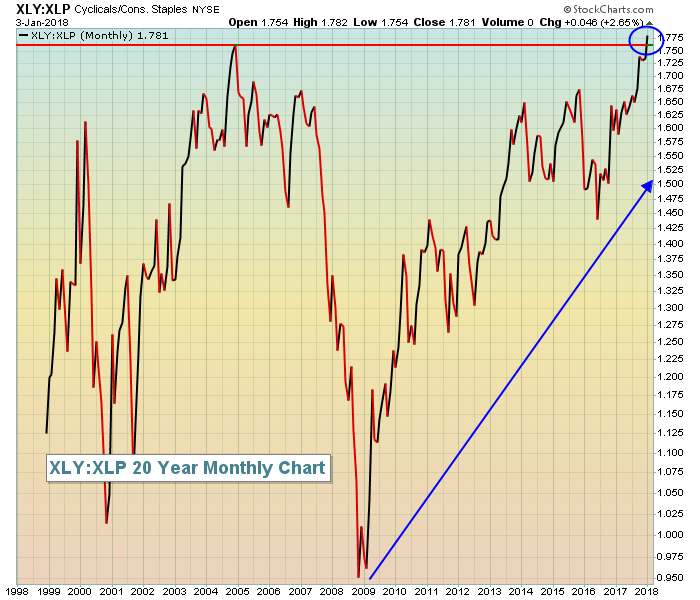
I often discuss how important the XLY:XLP ratio is in my analysis of the health and sustainability of any stock market advance. So I guess it's worth noting that this ratio (consumer discretionary ETF divided by consumer staples ETF) just broke out to an all-time high:
 This picture paints a thousand bullish words. Since this bull market began in 2009, this ratio has been climbing. Please understand that it doesn't rise every day or every week or even every month. But I believe it's obvious that it's been in a relative uptrend for years. Even the 2016 drop, which was scary, simply retested the triple top, relative breakout that had occurred in 2013, clearing prior relative highs near 1.43-1.44 that had been established earlier in 2011 and 2012. In my opinion, broken relative resistance becomes relative support and it certainly was in this case.
Finally, note what happened to this relative ratio in 2007, keeping in mind that the S&P 500 didn't top until October 2007. This ratio completely fell apart all year long as money rotated towards the defensive-oriented staples group. It was a major warning sign as to the health of that bull market. But now? It couldn't look any better. I remain very bullish as we head into 2018.
Sector/Industry Watch
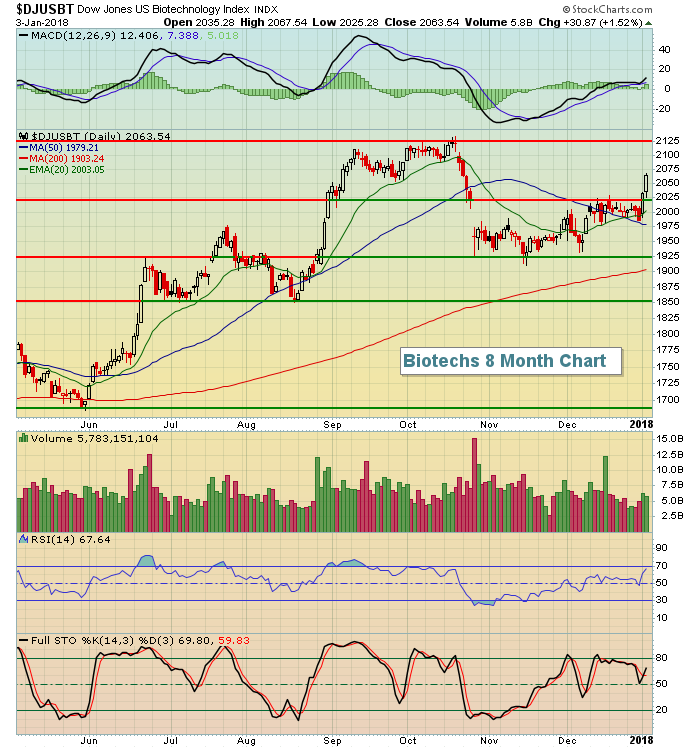
I'm a fan of biotechs ($DJUSBT). Yes, they've gone through periods of consolidation from time to time so patience is required occasionally, but the breakout in 2018 is obvious and looks to extend the rally that began back in June 2017. The one thing to understand about biotechs is that when they move, they really move! They're very similar to semiconductors in that regard. You don't have to look twice at their charts to see when a rally is underway. Check out the current visual:
 The only annotations I've added are levels of key price support/resistance. The three lower horizontal lines all mark significant price lows during the current uptrend. So long as this group continues to print higher lows on pullbacks, I'll remain interested on the long side.
The horizontal line that was just cleared in 2018 is key gap resistance from the huge selloff that took place back in late-October. The culprit was the huge selloff in Celgene Corp (CELG), but biotechs have rallied off those lows to completely fill that gap....and move higher - a bullish development. The top horizontal line is the next short-term price resistance and target for the group and I expect we'll test it sooner rather than later.
From a Big Picture standpoint (from a 10 year monthly chart), I see the DJUSBT currently forming a cup after a multi-year uptrend so my initial, more intermediate-term target is to form the right side of that cup at 2200. A breakout above 2200, which could occur in 2018, would measure to 2900. Hence, the reason for my bullish call on the group.
Historical Tendencies
John Murphy, my technical analysis superhero, recently suggested that the Santa Claus rally lasts through January 5th and I have the numbers back to 1950 on the S&P 500 that fully supports this notion. I'd even extend it to January 6th, but it's a moot point in 2018 as January 6th falls on a Saturday. Here are the annualized returns for each of the calendar days in this period (2018 performance to date is not included in these annualized returns):
January 2nd: +71.26%
January 3rd: +65.37%
January 4th: +10.62%
January 5th: +34.98%
Key Earnings Reports
(actual vs. estimate):
WBA: 1.28 vs 1.27
MON: .41 vs .38
Key Economic Reports
December ADP employment report released at 8:15am EST: 250,000 (actual) vs. 185,000 (estimate)
Initial jobless claims released at 8:30am EST: 250,000 (actual) vs. 240,000 (estimate)
December PMI services index to be released at 9:45am EST: 52.4 (estimate)
Happy trading!
Tom
