Market Recap for Friday, January 5, 2018
Not even a disappointing jobs report on Friday could slow down this bull market train. U.S. futures were strong before the release of December's nonfarm payrolls and they didn't give up a thing after the release, which showed that jobs were reported at 148,000, well short of the 191,000 forecast. The bond market did initially react as you might expect - with a quick drop in the 10 year treasury yield ($TNX) as soon as the weak jobs report hit the wires. Check it out on a 5 minute intraday chart:
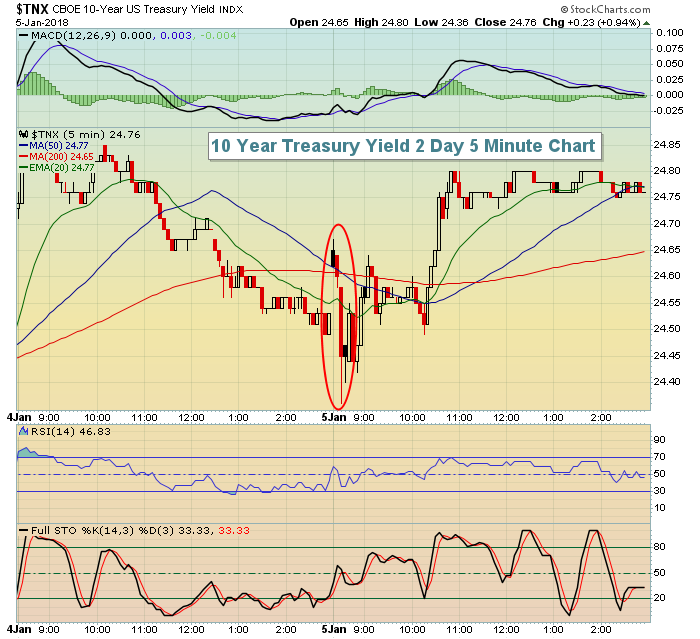 After setting up to open higher on Friday, the TNX fell very quickly as soon as Friday's disappointing jobs report was released. But the sellers of treasuries are nearly as resilient as the buyers of equities. So after the initial disappointment sunk in, treasury sellers were back at it again, with the TNX rising to close near 2.48%. Proceeds from treasury selling found its way into stocks once again as all of our major indices closed at record all-time highs for the third consecutive session. Wide participation is an ingredient of a bull market and we've certainly witnessed that to start 2018.
Seven of nine sectors finished higher on Friday with technology (XLK, +1.05%) at the top of the leaderboard. Mobile telecommunications ($DJUSWC) led the technology assault, which was a very bullish development after Thursday's heavy volume selling in this industry group threatened what appeared to be the start of a solid uptrend. Friday's recovery helped to alleviate any short-term fears stirred up from Thursday's selling:
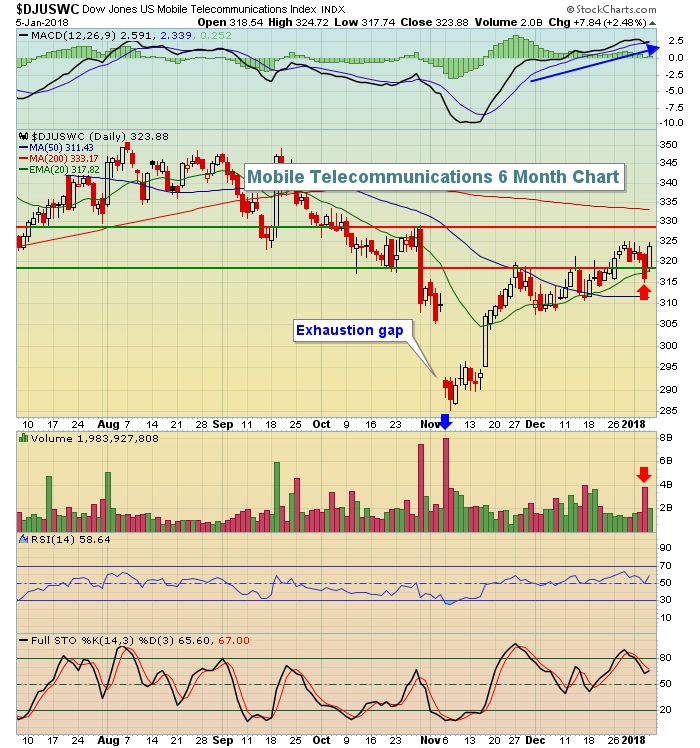 The blue arrow highlights what now appears to have been an exhaustive gap. We want to see the heaviest volume on the chart when an exhaustion gap prints and we saw that. Now the DJUSWC is trending higher to further support the notion of exhaustive selling. The red arrows, however, highlight the sudden reversal and failure to hold the rising 20 day EMA - and it was on unusually heavy volume. Fortunately, Friday's strength was able to push price action back above that 20 day EMA and that, at least temporarily, suggests the uptrend is back on track. A close above 329 would add to the bullishness of this industry.
Utilities (XLU, -0.04%) and energy (XLE, -0.04%) were the only two sectors that failed to participate in Friday's rally. The latter of these two has seen a melt up in its share price since its double bottom completed in mid-November, so a little profit taking did nothing to change its bullish chart. The XLU, on the other hand, continues to have an overhead lid on its price action as rising treasury yields keep pressure on the group.
Pre-Market Action
We saw another rally in Asia overnight, while European stocks are mixed. Here in the U.S., Dow Jones futures are down 15 points as equities pause - at least in pre-market action - after a robust start to 2018 last week. Crude oil ($WTIC) and gold ($GOLD) are slightly higher and slightly lower, respectively, in very early trading.
Current Outlook
To determine whether a bull market rally is sustainable is to look at aggressive vs. defensive ratios and see if they are rising along with the benchmark S&P 500. For instance, I like to watch the XLY:XLP ratio to see if the aggressive area of consumer stocks (discretionary) is outperforming the defensive consumer stocks (XLP). I compare transports (aggressive) to utilities (defensive). In the financial space, I'll many times review the $DJUSBK:$DJR ratio to ensure that banks are outperforming REITs.
But you can also review the major indices to see if aggressive indices are outperforming the more stable and defensive indices. For instance, the NASDAQ and Russell 2000 are widely viewed as more aggressive than their Dow Jones and S&P 500 counterparts. So if you want to see if NASDAQ stocks are outperforming the benchmark S&P 500, you can do so as follows:
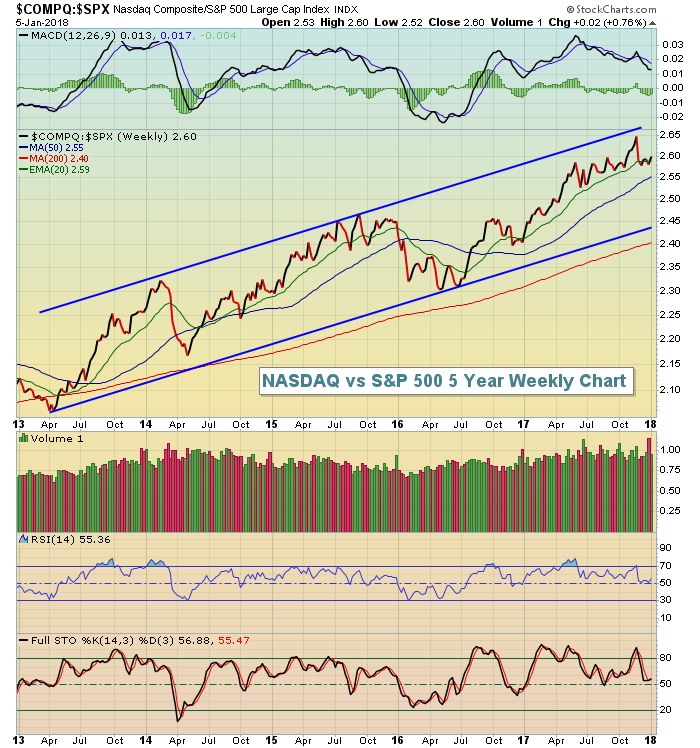 The overall market typically struggles when this ratio is declining. But an uptrending ratio tells us that traders/investors are content with taking more risk and buying NASDAQ shares. A higher risk appetite is usually present during major bull market advances. Therefore, it's very difficult to grow bearish equities when traders' risk appetite is so strong.
Sector/Industry Watch
It's been a great start to the year in most industries. However, gambling ($DJUSCA) isn't one of them. It looks to me like this is only a temporary problem as a negative divergence has printed and that suggests price momentum slowed and a consolidation period is upon us:
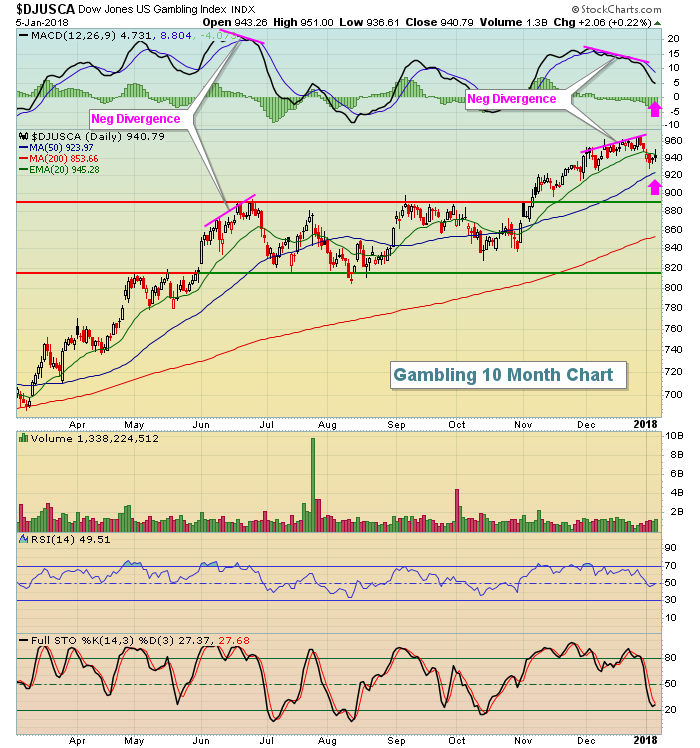 Once a negative divergence prints, I begin to look for a 50 day SMA test and/or a MACD centerline reset (pink arrows). We're getting closer to both. On a weekly chart (not shown), the rising 20 week EMA is at 902 and you can see from the above that strong price support resides at 890. So while it's frustrating to see an industry group fail to participate in a strong overall market advance, I would not write this group off. I simply think it needs a period of consolidation/basing before we see another sustainable rally. All of this isn't to say that gambling is guaranteed to fall further. It just looks like an area that might require a bit more time and patience if you're long.
Monday Setups
AeroVironment (AVAV) gapped up on very heavy volume in early December after posting excellent quarterly earnings results. AVAV's revenues (73.8 mil vs. 63.9 mil) and EPS (.29 vs. -.07) both easily topped Wall Street consensus estimates, leading to the huge move higher. Since topping just above 58, AVAV has been trending lower and on Friday closed at 53.40 after touching 52.69 on an intraday basis. That nearly retested the top of gap support at 52.52, which holds as major support in many instances. I expect that the current price down to 52.00 will hold as support so the reward to risk has certainly flipped to the long at this point. Here's the chart:
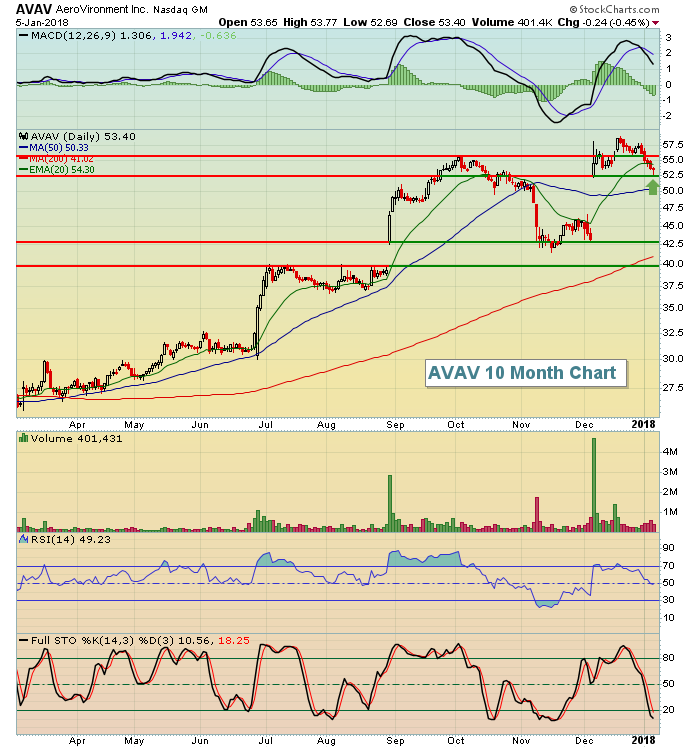 I think we're going to get a recovery in AVAV shares, it's just a matter of which support level holds. The initial support level is 52.52 in my opinion. If we close beneath 52.00, then I'd look to that rising 50 day SMA, currently at 50.33. If that doesn't hold, we could see the mid-40s. Therefore, I'd consider a fairly tight stop here, say below the 52 level.
For my other Monday trade setups, CLICK HERE. I'm updating this list currently, so if trade setups don't appear for today, check back in before 9:30am EST.
Historical Tendencies
The NASDAQ loves January and the love affair resumed at the start of 2018 with NASDAQ stocks exploding higher last week. Since 1971, January has ranked as the best calendar month of the year for NASDAQ stocks as they've posted an annualized return of +31.72%. This week the bullish tendencies ease a bit as you can see from the following January performance breakdown:
January 1-7: +56.64%
January 8-13: +15.84%
January 14-19: +54.56%
January 20-26: -14.80%
January 27-31: +32.85%
Key Earnings Reports
None
Key Economic Reports
None
Happy trading!
Tom
