Market Recap for Friday, November 24, 2017
Wall Street was only open for half a day on Friday, but that didn't stop the bulls' momentum as all the major indices closed at fresh all-time highs. Amazon.com (AMZN) and a host of semiconductor stocks led the advance as the NASDAQ slightly outperformed the other indices. Technology (XLK, +0.56%) and materials (XLB, +0.51%) were the best performing sectors, while consumer staples (-0.07%) and financials (XLF, -0.04%) lagged.
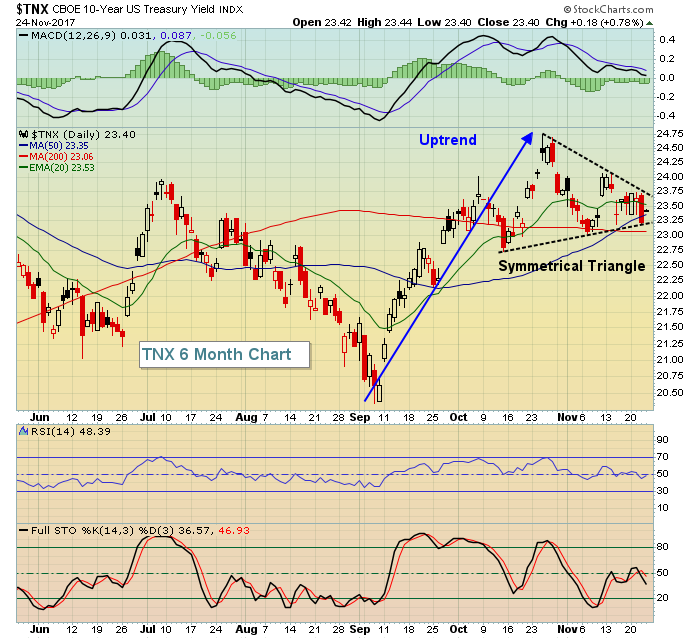
The 10 year treasury yield ($TNX) bounced back after it fell to challenge the lower uptrend line in its current symmetrical triangle:
 Over the past two weeks, we've seen the TNX squeeze between recent 2.30% yield support and 2.40% yield resistance. I suspect we'll see a triangle breakout in the TNX to the upside as money rotates away from the bond market to help fuel another stock market rally. However, a break to the downside beneath 2.30% would likely negate that scenario.
Pre-Market Action
Gold ($GOLD) is up $9 in early action as it nears the $1300 level, while crude oil ($WTIC) has dropped a little more than 1% after nearing $59 per barrel.
Asian markets were down overnight and European markets are barely lower this morning. U.S. futures, however, are up slightly. With 30 minutes left to the opening bell, Dow Jones futures are up by 13 points.
Current Outlook
The Russell 2000 ($RUT) tends to lead bullish market action from now through the end of the year. Historically, the RUT has advanced 26 of the last 30 years during the month of December and has produced annualized returns of +38.26%. From the November 22nd close through December 31st, the RUT has advanced 9 of the last 10 years, averaging a gain of +5.84% (annualized return: +37.88%).
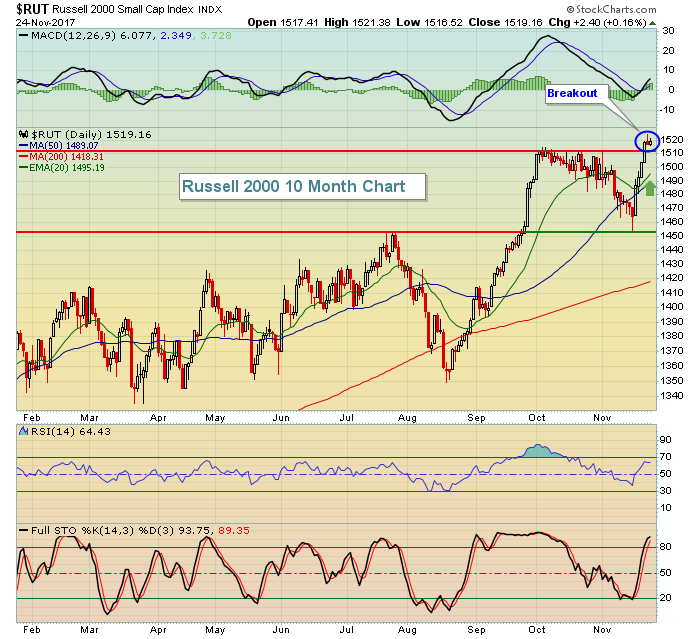
Technically, the RUT just broke out to all-time highs so I'd expect to see further strength into year end, especially given the seasonal strength. Here's the current technical view:
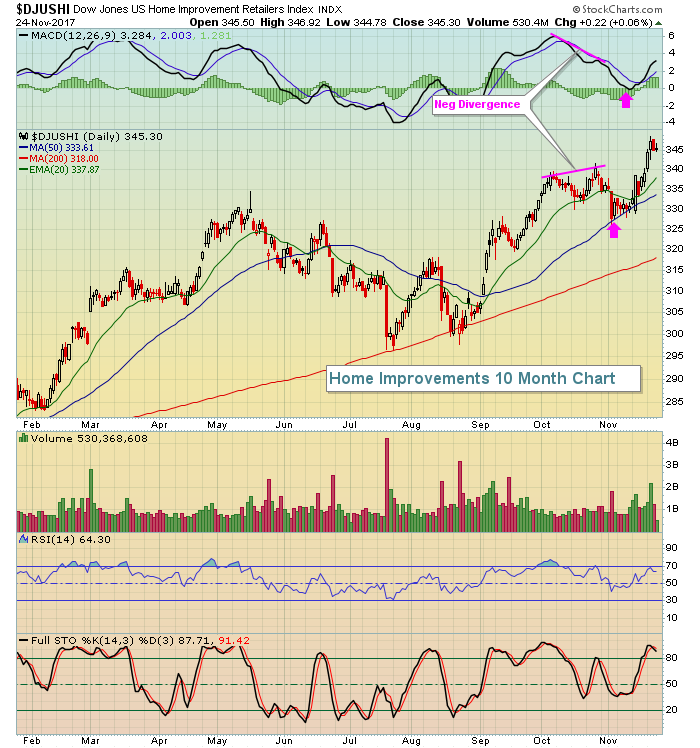
Home improvement retailers ($DJUSHI) showed signs of slowing momentum in late October, but weakness in November took the index value down to its 50 day SMA and reset the MACD back to centerline support. The latest breakout above prior highs comes with accelerating momentum. I'd look for continuing strength from home improvement companies to help lead the consumer discretionary sector higher. Here's the current chart of the DJUSHI:
 The daily RSI just hit 70 on the most recent high so look to the rising 20 day EMA for support if recently overbought conditions continue to be relieved. Short-term price support should be realized around the 340 level as well.
Historical Tendencies
We've entered a very bullish period for the Russell 2000 small cap index ($RUT). Since 1987, November 23rd through December 6th has produced annualized returns of +73.20%.
Key Earnings Reports
None
Key Economic Reports
October new home sales to be released at 10:00am EST: 620,000 (estimate)
Happy trading!
Tom

