Special Note
Today marks my 2 year anniversary of writing daily articles here in Trading Places. It's spanned some 500 articles. I love what I do and am completely blessed to be able to write about something I'm very passionate about. I'd like to ask a favor (actually two favors). First, please subscribe if you haven't already by scrolling down, typing in your email address and clicking on the green "Notify Me" button below. Then my blog articles will be automatically sent to your email address the moment they're published. I encourage you to do this for your other favorite blog authors here at StockCharts.com as well as that's our only way to know that you enjoy our work.
Second, drop me a line. My email is tomb@stockcharts.com. I'd love to hear your feedback about these past two years of Trading Places. Feel free to send suggestions on how I can improve my blog. I'd love to hear some success stories on ways this blog has impacted your trading. I can handle constructive criticism as well. :-)
Thanks.....and have a great holiday weekend!
Market Recap for Thursday, August 31, 2017
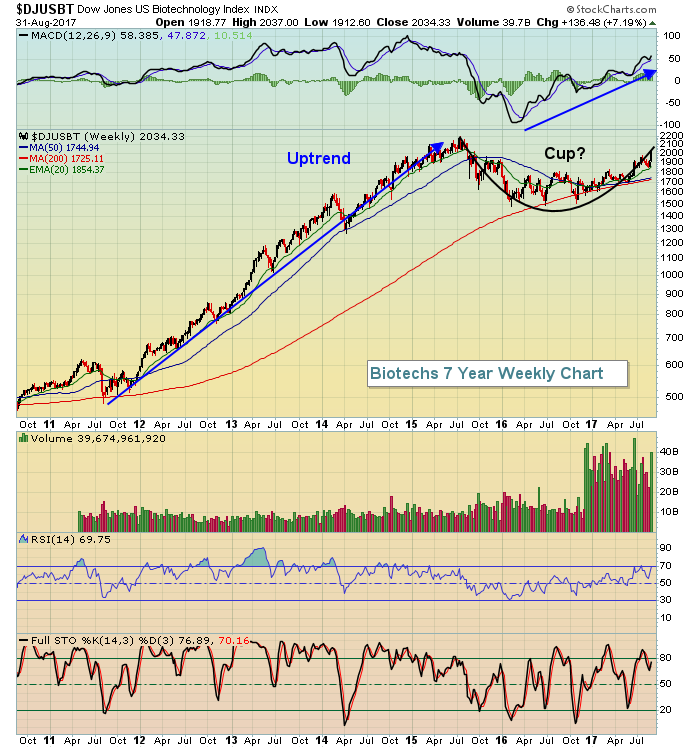
The biotechs ($DJUSBT) continue to power ahead and Thursday was simply another example of it. The DJUSBT is now up more than 7% this week and is well on its way to completing a cup formation following a prior uptrend. The pattern is quite bullish and is one of the reasons this group remains one of my favorites. Here's the latest technical look:
 While the forming of this right side of a cup is very bullish, the latest market advance isn't only about biotechs. All nine sectors gained ground yesterday and wide participation is very important as the stock market breaks to new all-time highs or approaches such breakouts. The reason? Well, if all sectors are rising and technically sound, it's difficult for the market to fall apart as all sectors are on buy signals. Where the market begins to struggle is after multiple sectors suggest that we sell.
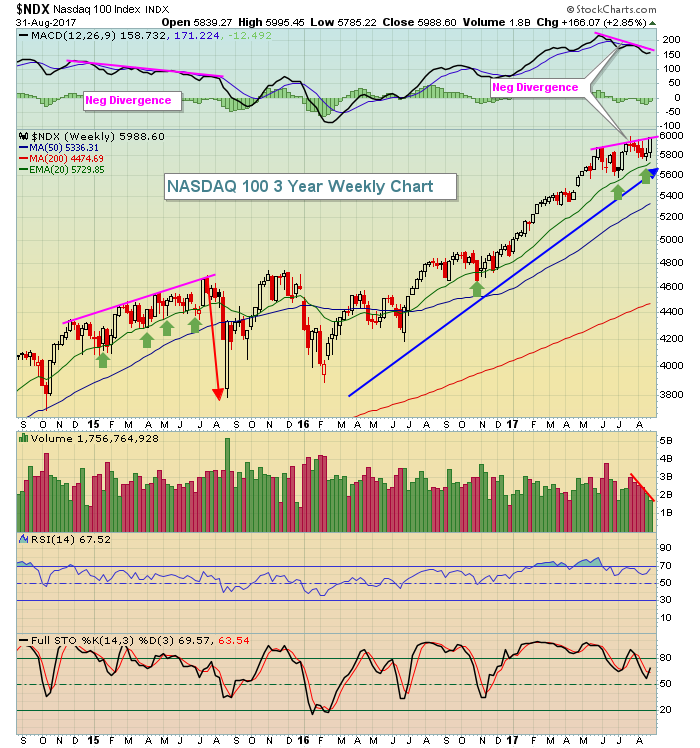
Yes, there remain negative divergences on many weekly charts. But remember one critical thing....the combination of price and volume trump all other indicators in my view. I will not ignore the NASDAQ 100 breaking out to an all-time high while being led by a very aggressive biotech group.
Over the past week, every industry group in technology (XLK) and industrials (XLI) has advanced. Every single one. In consumer discretionary (XLY), 20 of 23 industry groups have advanced. It's difficult to ignore the price action so until we see a major price reversal, I'd err on the side of bullishness.
Pre-Market Action
Gold ($GOLD) is up again this morning and the consistent strength after breaking above major trendline and price resistance is quite bullish. The 10 year treasury yield ($TNX) surprisingly remains low and near 2.10% support. Global markets are mostly higher, especially in Europe this morning.
Despite a lower than expected jobs number this morning, Dow Jones futures are up 54 points with less than 30 minutes to the opening bell. I'd grow much more cautious if we see a big reversal today so be on the lookout for that. Otherwise, a breakout should be respected even though we're entering the historically bearish month of September.
Current Outlook
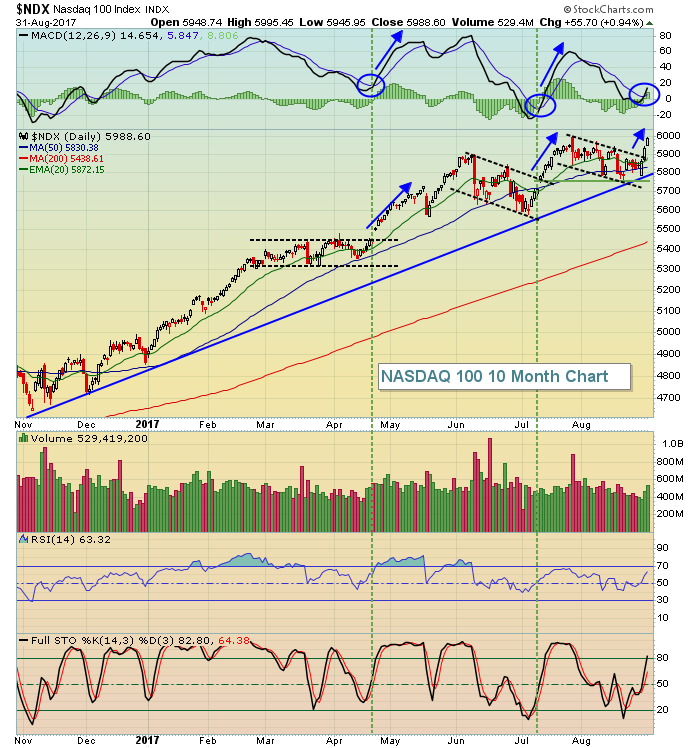
Let me say this. Never, ever, ever underestimate the power of bull markets. They crush perma-bears. Bear markets don't occur very often so it really doesn't pay to always be trying to call a top. Having said that, recognizing periods of consolidation can save thousands of dollars in a trader's portfolio. Some of my worst trades have resulted from me thinking like a bear during a bull market. So that begs the question.....should we be bullish or bearish right now? Well, the U.S. stock market has faced tons of hurdles over the past few months and yet here we are, points away from an all-time high on the benchmark S&P 500. Yesterday, the NASDAQ 100 ($NDX) closed at an all-time high. Check out the daily and weekly charts of the NDX to see the bullish and potentially bearish views to consider:
Daily chart:
 When one of the most aggressive indexes closes at an all-time high, it's awfully difficult to be bearish. That just doesn't make good common sense. Market participants are choosing to be very aggressive with their money and that typically coincides with bull markets. And if you look at the chart above, we've just broken out from a period of consolidation that spanned most of August and did so with expanding volume. Again, this is very bullish behavior. You can see that previous breakouts of such consolidation periods in 2017 resulted in momentum accelerating and prices rising. Bears are counting on this time to be different. Best wishes.
So how can we be bearish based on the Thursday breakout? Well, if this breakout fails to hold - and that's critical - then we can look to the longer-term weekly charts where we still have signs of slowing price momentum.
Weekly chart:
 The best news for the bears would be a positive reaction to the jobs report today with a big move higher, followed by heavy selling and a reversal this afternoon. That would leave a long tail and false breakout on the weekly chart with a nasty divergence in place. I'd move to cash if that occurs - at least in the very near-term. While September doesn't guarantee us that we'll see lower prices, it's a historical fact that the odds that the S&P 500 will finish lower in September is higher than any other calendar month. Since 1950, September is the only calendar month that's moved lower more often than it's moved higher.
Bottom line: Let the price action dictate what moves you need to make in September. Trade what you see, not what you hope or feel. Also, in terms of trading choices, stick to areas of the market that do not show slowing price momentum on their weekly charts as these areas should perform well in a rising market and have the best chance to weather any short-term selling.
Sector/Industry Watch
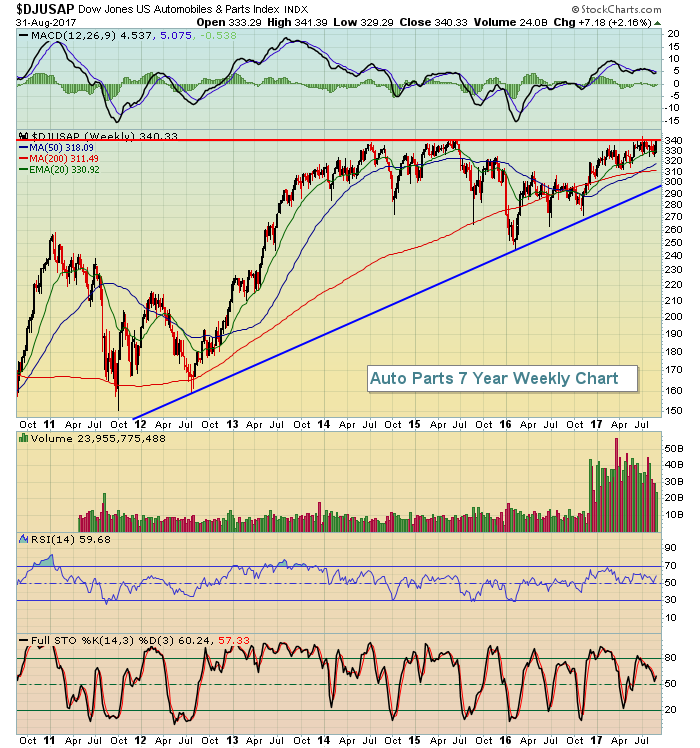
The Dow Jones U.S. Auto Parts Index ($DJUSAP) is on the verge of a major breakout and I wrote about it briefly in Thursday's Don't Ignore This Chart article, "Auto Parts Getting Its Engine Revving; Approaching Major Breakout". In case you missed it, here's that long-term look at key resistance:
 Yesterday's close of 340.33 is a little more than a point away from its all-time high close of 341.88. This group has been patiently consolidating beneath this resistance for years, so a breakout shouldn't be taken lightly. BorgWarner (BWA) is one of my favorites in the group as they recently posted excellent quarterly revenues and earnings that easily topped Wall Street forecasts (Revs: 2.39 bil vs. 2.27 bil, EPS: .96 vs .89). A breakout in the industry group would likely be a major tailwind for a stock like BWA.
Historical Tendencies
Well, it's the first calendar day of the month and that's generally a bullish day historically. The following represents the annualized returns of the 1st calendar day of the month by major index:
S&P 500 (since 1950): +45.72%
NASDAQ (since 1971): +58.97%
Russell 2000 (since 1987): +43.03%
The 1st calendar day of the month is easily the best calendar day of the month. To give you some perspective, however, the 1st calendar day doesn't go up every month. On the NASDAQ, for instance, the 1st day has risen 223 times and fallen 130 times. It's not a slam dunk. It's a tendency.
Key Earnings Reports
None
Key Economic Reports
August nonfarm payrolls released at 8:30am EST: 156,000 (actual) vs. 180,000 (estimate)
August private payrolls released at 8:30am EST: 165,000 (actual) vs. 180,000 (estimate)
August unemployment report released at 8:30am EST: 4.4% (actual) vs. 4.3% (estimate)
August hourly earnings released at 8:30am EST: +0.1% (actual) vs. +0.2% (estimate)
August ISM manufacturing index to be released at 10:00am EST: 56.6 (estimate)
July construction spending to be released at 10:00am EST: +0.6% (estimate)
August consumer sentiment to be released at 10:00am EST: 97.4 (estimate)
Happy trading!
Tom
