Market Recap for Monday, August 14, 2017
When the stock market goes up, I want to see money rotate towards aggressive areas and we definitely saw that on Monday. Technology (XLK, +1.59%), financials (XLF, +1.37%) and industrials (XLI, +1.05%) were the three big winners on the session and they're all considered aggressive sectors. I also like to see wide participation and eight of the nine sectors advanced. The final piece to the bullish puzzle is heavy volume. That was clearly lacking yesterday as NASDAQ volume was just 1.7 billion shares, well below its 50 day moving average. However, let's keep in mind it's the depths of summer when we typically see lighter volume. Still, here's the chart:
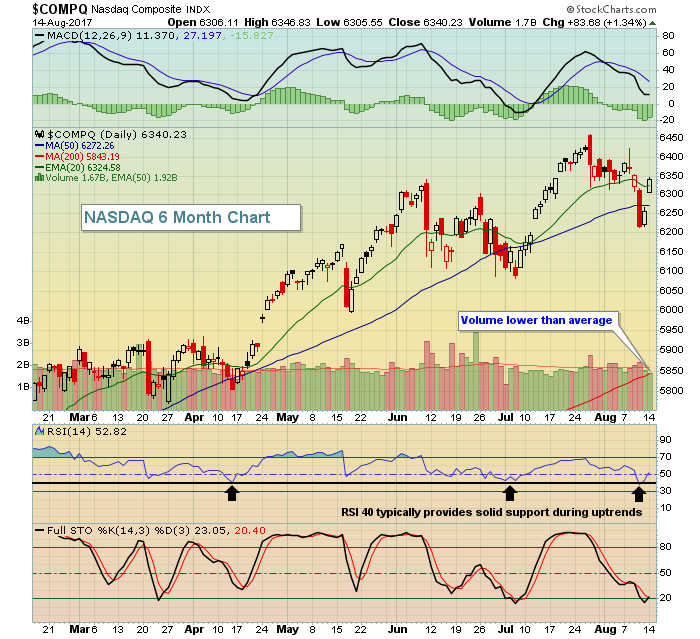 Technically, it was important for the bulls to quickly re-establish price action above both the 20 and 50 day moving averages and they were both accomplished yesterday. While this action doesn't eliminate the potential issues relating to weekly negative divergences, it definitely points to further consolidation to help alleviate that longer-term slowing momentum, rather than panicked selling that we were beginning to witness last week.
Energy (XLE, -0.30%) was again the laggard and the short-term prospects are not good as the XLE has lost price support after sideways consolidating for the past 2 1/2 months between 64-67. Monday's close of 63.75 set a new 52 week low close with only the July 7th intraday low of 63.29 providing any support for the bulls. It remains a bleak picture in energy:
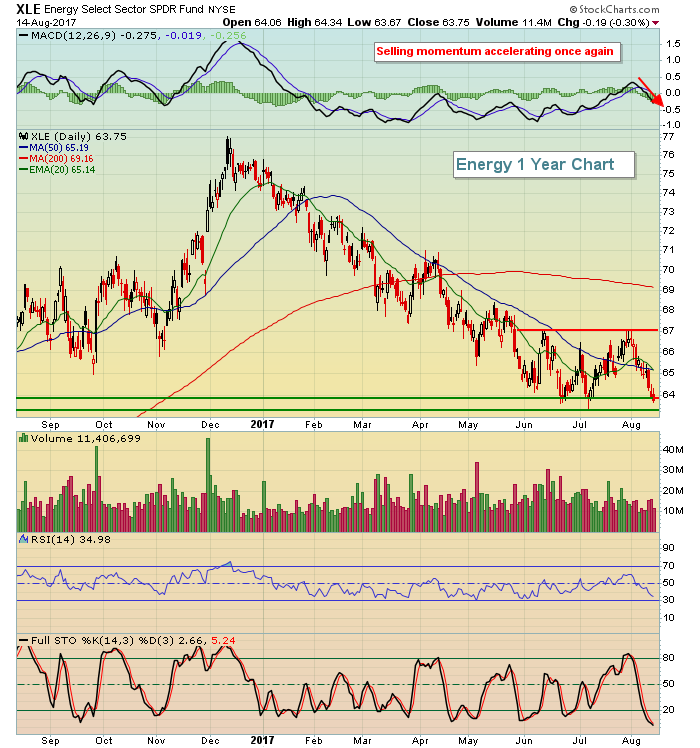 A reversing candle at this level is likely the last short-term hope for the energy bulls. Failing to hold the intraday support level from early July would trigger more stops and keep money from rotating into this area.
Pre-Market Action
Stronger than expected economic news, particularly retail sales, has seen bond prices tumble this morning with the 10 year treasury yield ($TNX) up six basis points to 2.28%. That's lifted the dollar and is putting pressure on both crude oil ($WTIC) and gold ($GOLD).
As a result of the strong economic news and healthy earnings surprise from Dow component Home Depot (HD), Dow Jones futures are higher by 46 points.
Current Outlook
Technology shares (XLK) have been the undisputed leader for the S&P 500 for the past four years with few hiccups along the way. June was a hiccup for sure, but technology has roared back and its relative strength vs. the benchmark S&P 500 hit a fresh high yesterday - a bullish signal for equities:
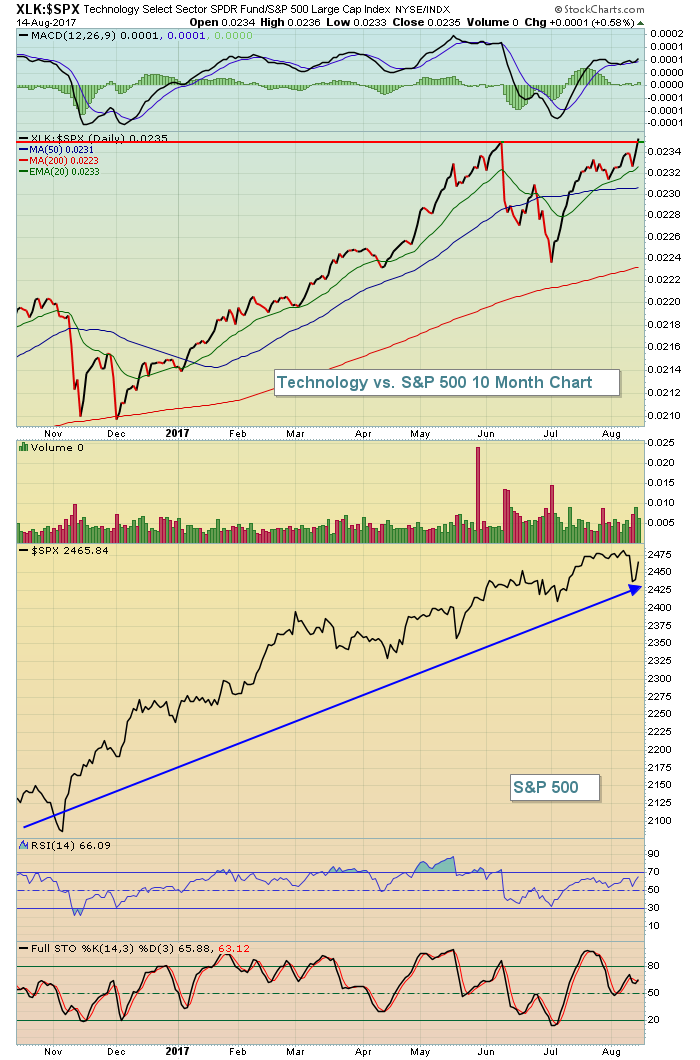 If the long-term weekly negative divergences are going to reset in the technology space, it's likely going to be a process as traders piled back into the group on Monday. I'm expecting more whipsaw action. On the NASDAQ 100 ($NDX), remember the latest selling occurred after the NDX failed to clear 5935 on a closing basis. So that's a level to watch closely on the NDX.
Sector/Industry Watch
Aerospace ($DJUSAS) remains very strong with momentum (MACD) rising to accompany recent higher price action. The trip back to test the rising 20 day EMA, however, has been met with a rapidly-declining MACD. While I still like the group in the near-term on this 20 day EMA test, you should be aware that another price high to clear the August 7th high close will almost certainly print a much lower MACD reading. Here's the visual:
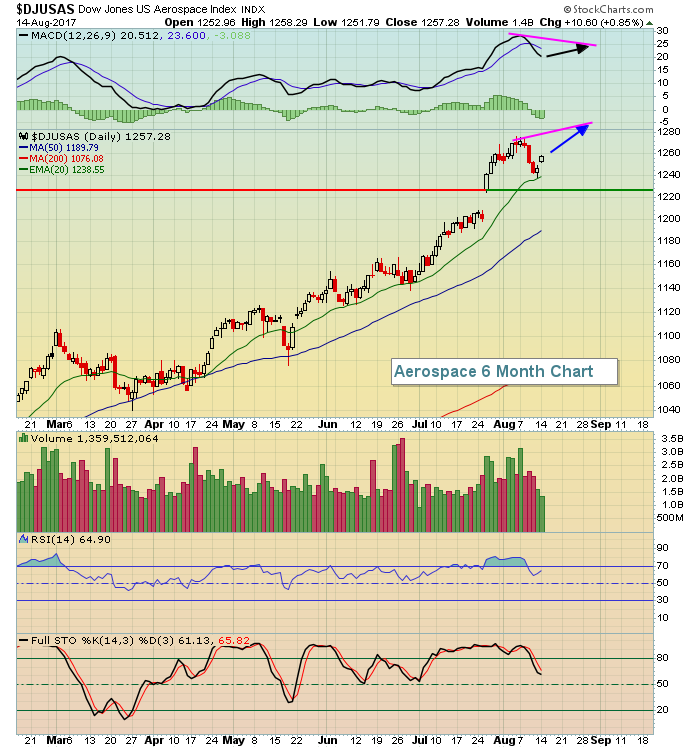 Anticipation of a negative divergence would not have me selling my existing aerospace stocks. Not at all. But it would provide me a warning that if I owned stocks in this space that began to show signs of slowing momentum - negative divergences, much lighter volume on breakouts, etc., I might want to lighten my exposure by selling a portion or all of those stocks.
Historical Tendencies
Aerospace stocks were featured above so I figured I'd provide you the seasonal tendencies for the group. They tend to hang in ok during the summer months, although August can sometimes be an issue. Here's the breakdown by month:
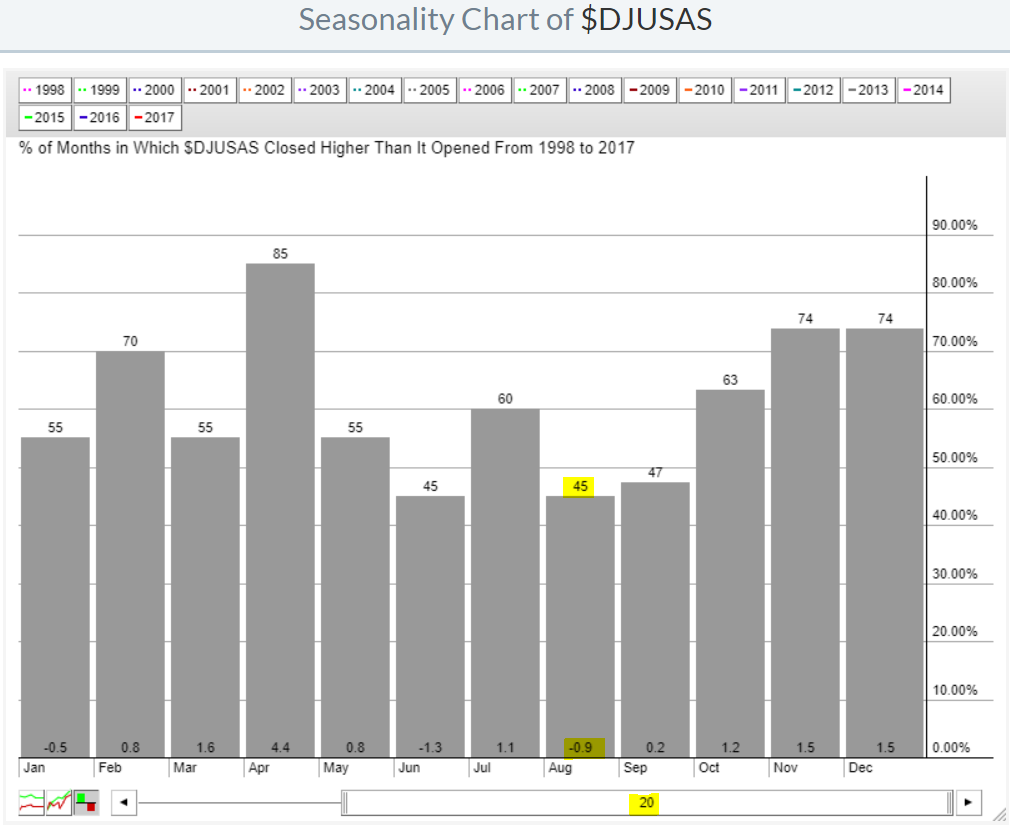 Seasonal strength does build into year end, but we'll need to negotiate the weaker months of August and September first. Keep this in mind if the slowing momentum issues mentioned earlier materialize.
Key Earnings Reports
(actual vs. estimate):
COH: .50 vs .49
HD: 2.25 vs 2.21
TJX: .85 vs .84
(reports after close, estimate provided):
A: .52
Key Economic Reports
July retail sales released at 8:30am EST: +0.6% (actual) vs. +0.3% (estimate)
July retail sales less autos released at 8:30am EST: +0.5% (actual) vs. +0.3% (estimate)
August empire state manufacturing survey released at 8:30am EST: 25.2 (actual) vs. 9.8 (estimate)
June business inventories to be released at 10:00am EST: +0.4% (estimate)
August housing market index to be released at 10:00am EST: 65 (estimate)
Happy trading!
Tom
