Market Recap for Tuesday, August 1, 2017
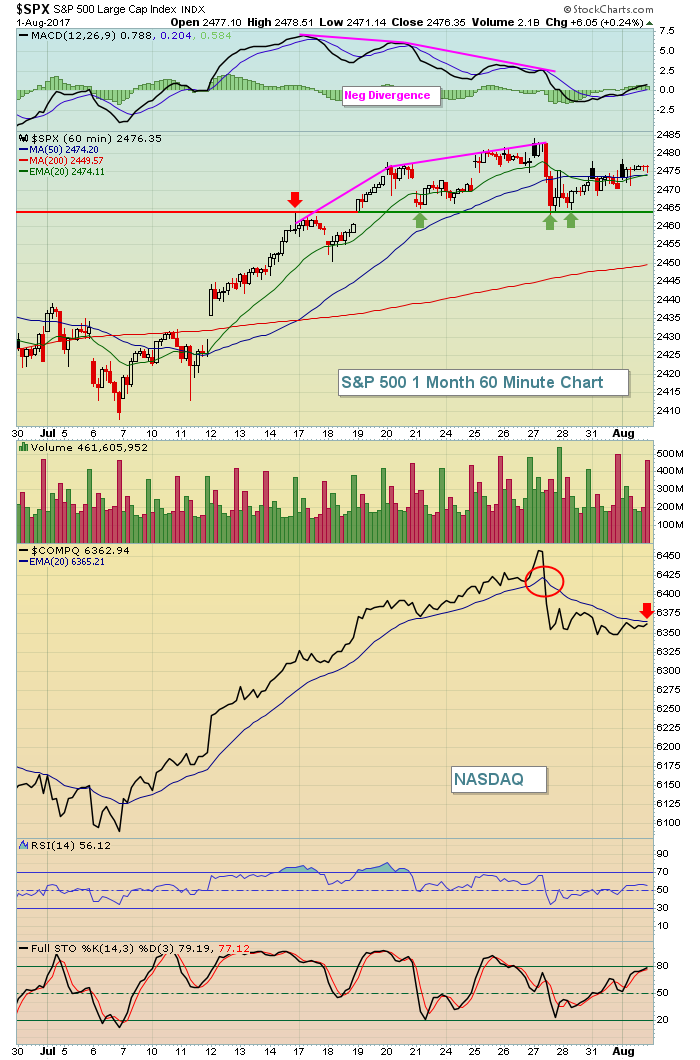
It was a rather boring day on Wall Street Tuesday, albeit a bullish one, as all of our major indices finished the day higher. Both the S&P 500 and NASDAQ tight-roped along key support/resistance levels as you can see below:
 All of the S&P 500's action was safely above gap and price support, while the NASDAQ never could quite get enough buying pressure to clear its suddenly-declining 20 day EMA. Given the strong futures this morning, both should be comfortably above support as a new trading day begins.
Financials (XLF, +0.72%) were the unexpected sector leader on Tuesday. We don't typically see banks ($DJUSBK) gaining 1% on a day when the 10 year treasury yield ($TNX) is hit hard, but that's exactly what we saw yesterday. Normally, utilities (XLU, +0.56%) are a primary beneficiary when interest rates are falling and that also happened on Tuesday. In fact, the XLU closed at a five week high.
It was fairly clear to me that traders were holding their collective breaths awaiting Apple's (AAPL) quarterly report, knowing full well that the NASDAQ had been under relative weakness the past several sessions and needed its leader to step up. After hours, that's exactly what AAPL did.
Pre-Market Action
The 10 year treasury yield ($TNX) is up 2 basis points after tumbling on Tuesday. Gold ($GOLD) is taking a breather this morning after a steady July climb and crude oil ($WTIC) is flat.
The July ADP employment report was released this morning and jobs came in slightly above expectations - 178,000 vs 173,000. Traders will be focused on Friday's government nonfarm payrolls report as further proof that the U.S. economy is growing as the Fed has predicted.
Apple (AAPL) reported its latest quarterly results after the closing bell on Tuesday and traders loved what they saw. AAPL topped expectations and is poised to open at an all-time high this morning, up roughly 6% from Tuesday's close. This earnings beat is widely expected to help carry technology higher, with NASDAQ futures up strongly this morning.
Current Outlook
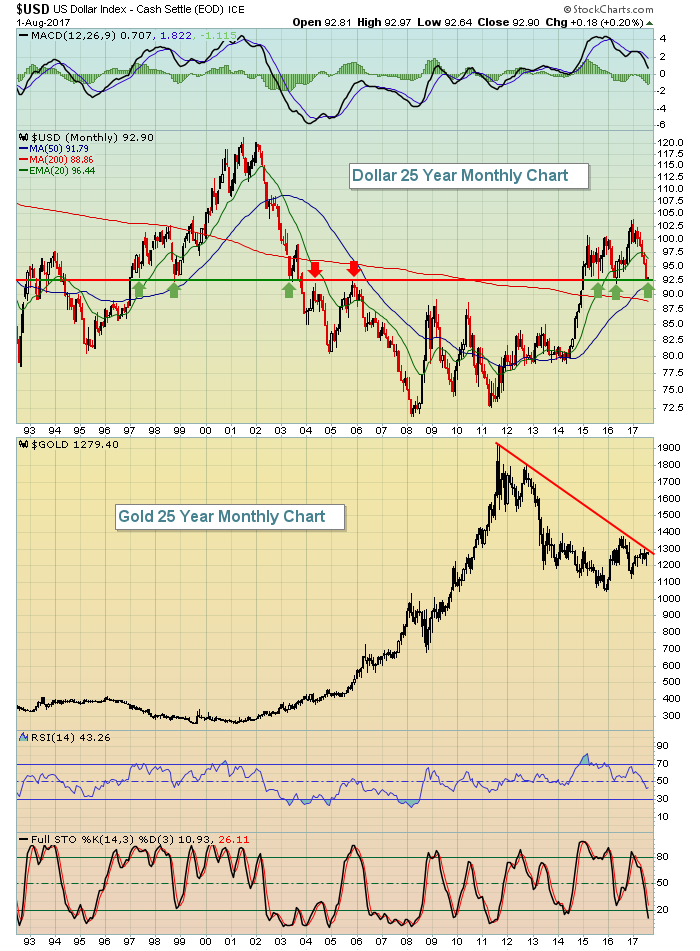
The U.S. Dollar Index ($USD) has been in free fall mode since the beginning of 2017. While the reaction in gold ($GOLD) has been bullish, we've yet to see the significant breakout in gold that could trigger a much longer-term uptrend. Here's a long-term chart of both:
 Note first that the 92.50-93.00 area on the USD has been a key pivot area for years. We're at that support level now so the most probable move from here is up. But it'll be critical to watch to see what the dollar does, because it'll likely have a major impact on gold. Gold is approaching 1300 and a push above that level would clear a critical 6 year downtrend line and encourage more money from the sidelines.
Sector/Industry Watch
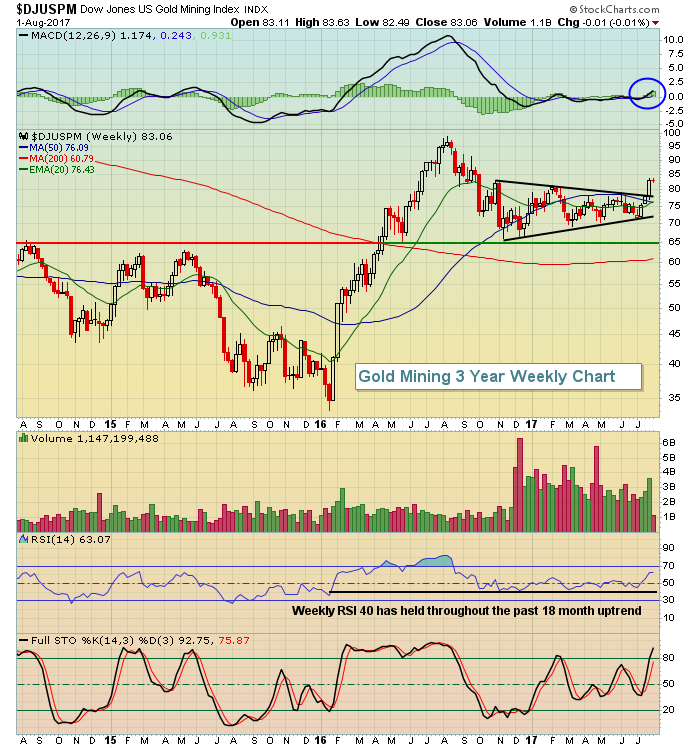
A breakout in gold would be a huge catalyst for the gold mining index ($DJUSPM), where we currently see bullish action taking place on the weekly chart. The index recently surged to 2017 highs and its weekly MACD is turning up off centerline support - a bullish signal. We also saw a golden cross as the 20 week moving average is now above the 50 week moving average. None of this guarantees higher prices, but the bullish stage is set if the price of gold can negotiate 1300 trendline resistance:
 I have maintained a bearish stance on gold, mostly because of that long-term downtrend and its inability to push through 1300. We're remained in an 8 year bull market that still shows no signs of letting up and that keeps gold buyers at bay. Also, I've expected to see interest rates here in the U.S. rise and that normally helps to prop up the dollar and deter gold buying. But because global interest rates have risen faster than U.S. rates, the dollar has remained under pressure throughout 2017 and the gold market is receiving mixed signals - a strengthening U.S. economy and bull market, but with a falling dollar.
Historical Tendencies
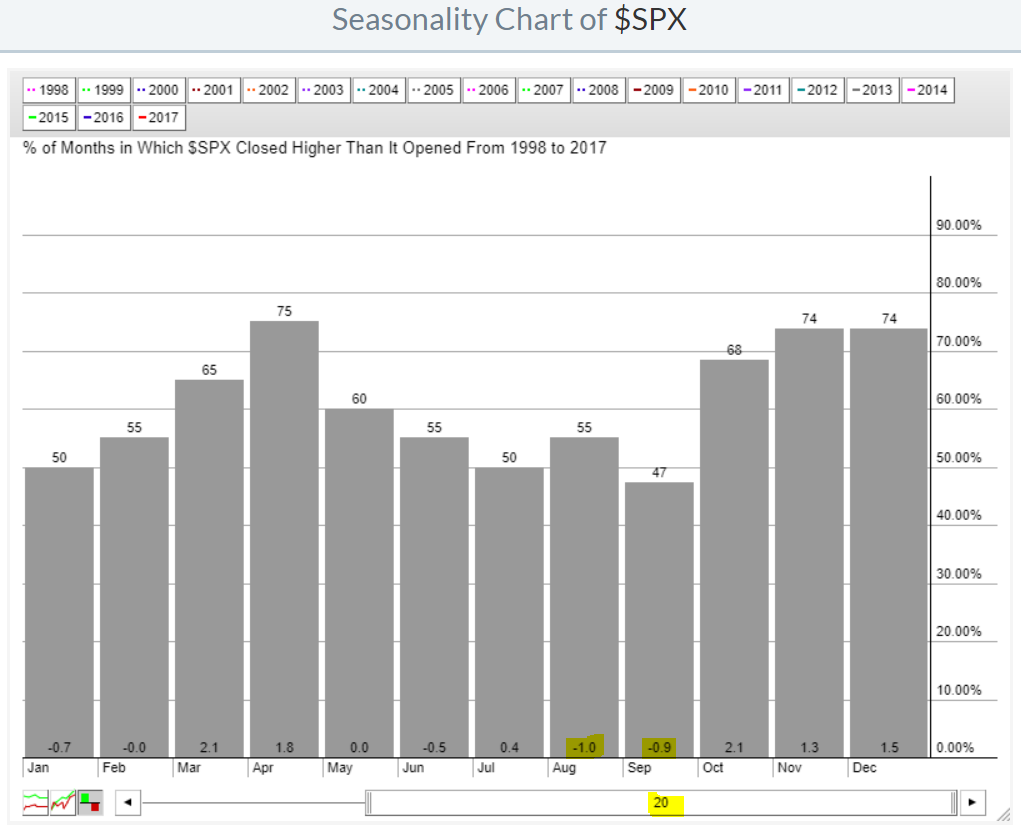
Despite all of the recent bullishness, August and September are clearly the two worst consecutive calendar months for the benchmark S&P 500:
 Given the seasonal weakness and weekly negative divergences across many charts, the bulls should consider themselves very lucky if the S&P 500 finishes September near its current level. That consolidation would be excellent news in that it likely would reset weekly MACDs to centerline support and see price action move closer to its rising 50 week SMA.
Key Earnings Reports
(actual vs. estimate):
CAH: 1.31 vs 1.24
D: .67 vs .66
DLPH: 1.71 vs 1.65
EXC: .54 vs .54
FIS: 1.02 vs .97
HUM: 3.49 vs 3.08
ING: vs .38 (haven't seen actual EPS yet)
MDLZ: .48 vs .46
SO: .73 vs .70
TWX: 1.33 vs 1.19
(reports after close, estimate provided):
AIG: 1.20
AVB: 2.14
EQIX: 3.41
LVLT: .39
MET: 1.28
NXPI: 1.32
OXY: .12
PRU: 2.70
SYMC: .12
TSLA: (2.00)
WMB: .19
WPZ: .42
Key Economic Reports
July ADP employment report released at 8:15am EST: 178,000 (actual) vs. 173,000 (estimate)
Happy trading!
Tom
