Market Recap for Monday, July 3, 2017
Energy (XLE, +1.93%) had another strong day as crude oil ($WTIC) surged above $47 per barrel and tested its 50 day SMA for the first time in over a month. The XLE has overhead resistance issues using multiple time frames, the first of which is featured below on its daily chart:
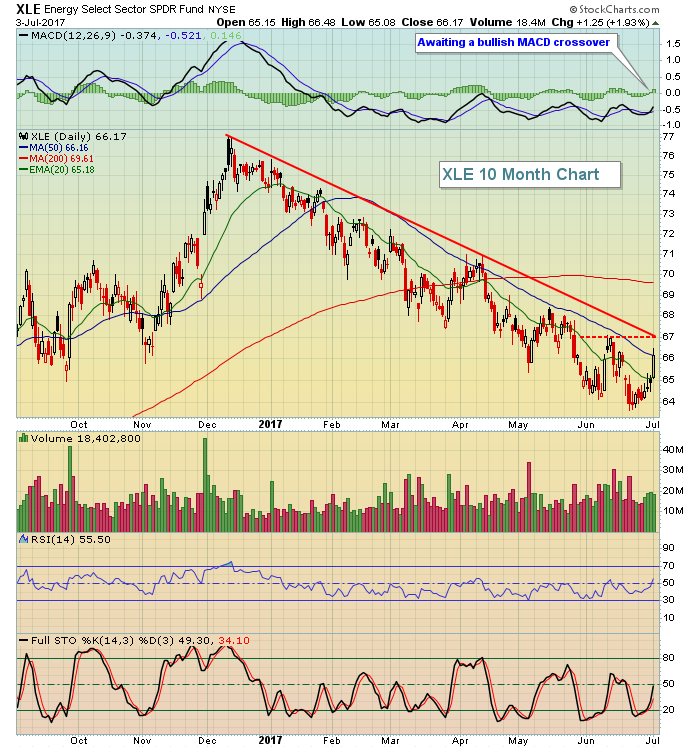 67.00 is a significant technical obstacle on the daily chart because there's a combination of recent price resistance and seven month trendline resistance at that price level. But the technical issues don't stop there. If we pull up a weekly chart, you'll see accelerating downside momentum in terms of the weekly MACD and an upcoming 20 week EMA test (red arrows below) - a point where many countertrend rallies fail. Take a look:
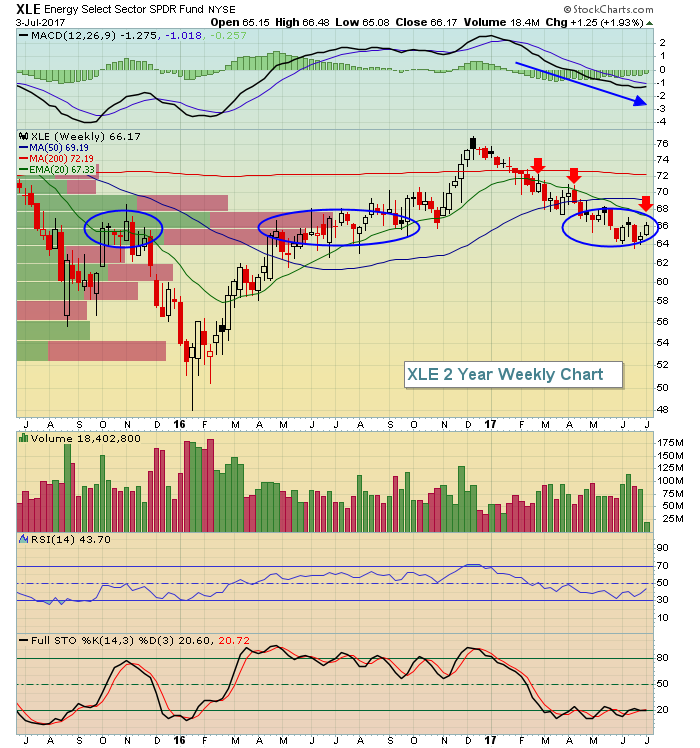 Currently, the 20 week EMA is at 67.33 so that moving average will be very interesting to watch as this rally unfolds. Note that I've also plotted the "volume by price" bars on this chart and it tells us that there's a lot of congestion (blue highlighted areas) in the 64-68 price range. Should the XLE break and close above its 20 week EMA, it could be the start of a much stronger intermediate-term rally.
Financials (XLF, +1.46%) also performed extremely well with the XLF closing at its highest level since March 1st - and just two pennies beneath that March 1st close. It's also worth mentioning that the all-time intraday high of 25.21 (set in 2007) was nearly cleared on Monday as well (25.19 was the high). Look at this chart to understand the technical significance of the current XLF price:
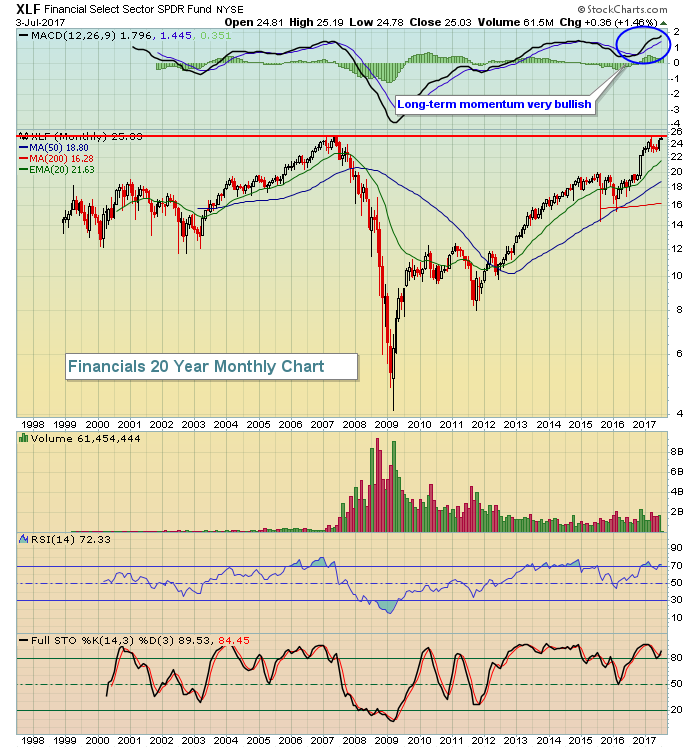 The monthly MACD is strong but overbought. I fully expect we'll see new highs on the XLF and more likely sooner rather than later. However, if it does pull back over the balance of the summer, keep in mind that the longer-term looks very bright for this group.
Bifurcation was once again a problem for the overall market. So while we saw great strength in energy and financials, there were four sectors - both consumer sectors, utilities and technology - that fell on Friday. The latter (XLK, -0.69%) continued its recent woes and needs to reverse course soon.
Pre-Market Action
This is a short trading week as U.S. markets closed early on Monday and were closed the entire session yesterday. Still, there are market moving reports due out this week. The first such report is the FOMC minutes which could reveal additional nuggets of information for traders from the last FOMC meeting held three weeks ago. Typically, the ADP employment report is issued the Wednesday prior to the nonfarm payrolls, which will be released on Friday morning at 8:30am EST. This month, however, the ADP employment report has been pushed back due to the July 4th Independence Day holiday. We'll get that first glimpse of June payrolls tomorrow morning at 8:15am EST.
May factory orders will be released later this morning at 10:00am EST.
Earnings season will officially begin next week, but key market moving earnings reports will begin in earnest in a couple weeks. In the meantime, the U.S. stock market will look to technical developments elsewhere and focus on the upcoming jobs reports, which will heavily influence the direction of treasury yields.
Dow Jones futures are mostly flat (up 5 points) with 30 minutes left to the opening bell. NASDAQ futures are modestly weaker as we're likely to see further selling pressure on technology stocks as we open the first full trading session of the week.
Current Outlook
Many technicians view the technology group to have broken down from a topping head & shoulders pattern as follows:
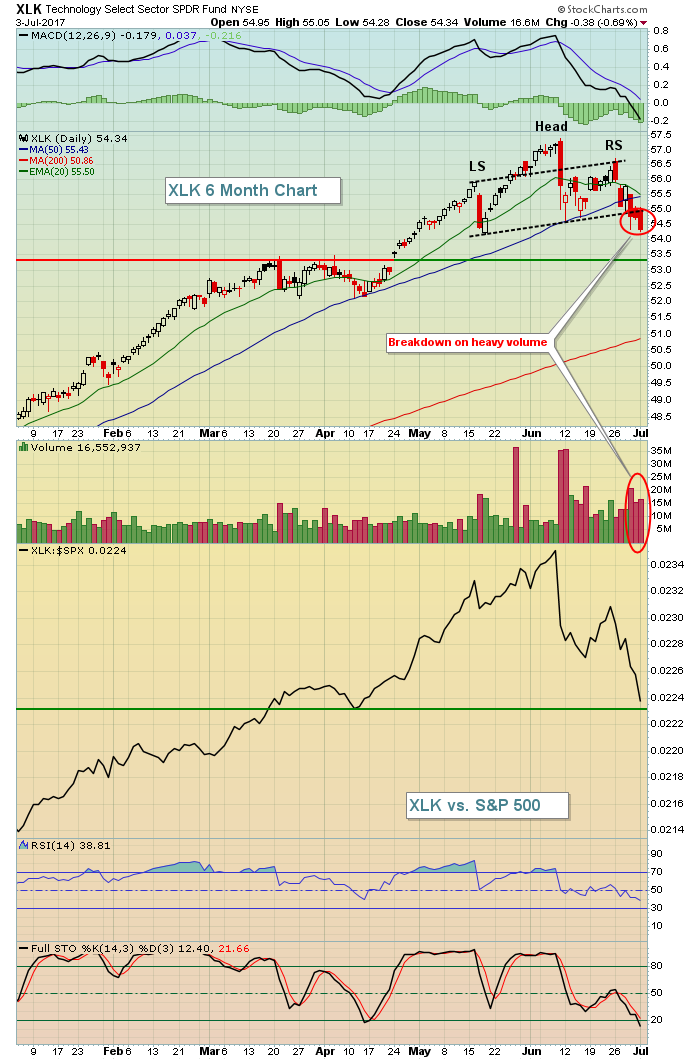 I recognize the pattern and certainly suggest caution given the recent developments in technology, but I don't look for this pattern to reach its measurement. First, I believe we're still in a bull market so I'm not in favor of expecting prices to top. Second, I don't trust necklines that slope higher for one simple reason. You can see neckline breakdowns without seeing price support breakdowns. I see two key areas of price support for the XLK that has yet to be broken. The first is the mid-May low near 54.20 and the most significant price support level is the breakout from April where the double top close to 53.50 was cleared. That led to excellent relative strength in technology and we're just now moving lower to test relative support.
I'm cautious technology, but actually awaiting a blowoff bottom in the current downtrend rather than continuing selling to reach any potential head & shoulder pattern measurement, which would be approximately 52.00. I guess we'll soon find out.
Sector/Industry Watch
The 10 year treasury yield ($TNX) has broken out of a bullish wedge so I'm looking for the TNX to potentially threaten the 2.61% yield resistance level that was reached in December 2016 and revisited in March 2017. Here's the chart:
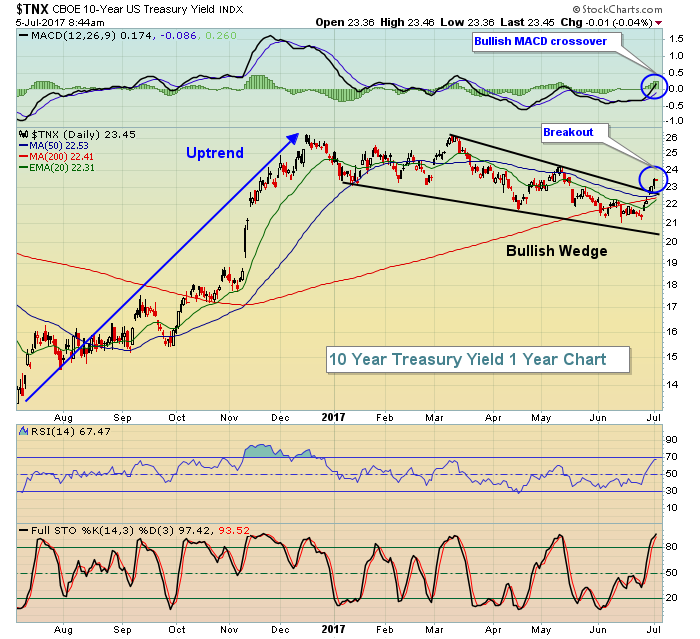 Momentum is accelerating in the TNX and higher rates favor financials, especially banks ($DJUSBK) and life insurance companies ($DJUSIL). Utilities (XLU) tend to suffer during periods of rising treasury yields.
Historical Tendencies
July is a strange month for NASDAQ performance. Since 1971, the first ten days of July have produced annualized returns of -1.89%. However, July 11th through the 17th have produced annualized gains of 58.91%, most likely due to earnings expectations. We'll see if this past seasonal trend holds true again this year.
Key Earnings Reports
None
Key Economic Reports
May factory orders to be released at 10:00am EST: -0.6% (estimate)
FOMC minutes to be released at 2:00pm EST
Happy trading!
Tom
