Special Announcement
At 4:30pm EST this afternoon, just after the U.S. stock market closes, I'll be joining John Hopkins, President of EarningsBeats.com, for a special 90 minute presentation. John will discuss the benefits of trading companies that have reported strong quarterly revenues and earnings (ahead of Wall Street estimates) and I'll demonstrate how to create ChartLists of these companies and how you can set up specific scans of this ChartList using the tools here at StockCharts.com. It'll be a powerful presentation, one that could significantly improve your chances of trading success. To join us, simply CLICK HERE for more information on how you can reserve your spot to this afternoon's event!
Market Recap for Friday, June 16, 2017
Amazon (AMZN) reached into its corporate wallet, pulled out more than $13 billion and shook up the food and drug retail market and other broadline retailers by acquiring Whole Foods Market (WFM). Shocks were felt in companies like Wal-Mart (WMT), Target (TGT) and Costco (COST) too. If I had to pick two companies that I would NOT want to move into my market as competition, it would be Apple (AAPL) and Amazon. Many food, drug and broadline retailers realized their worst nightmare on Friday and it showed in the reaction of traders.
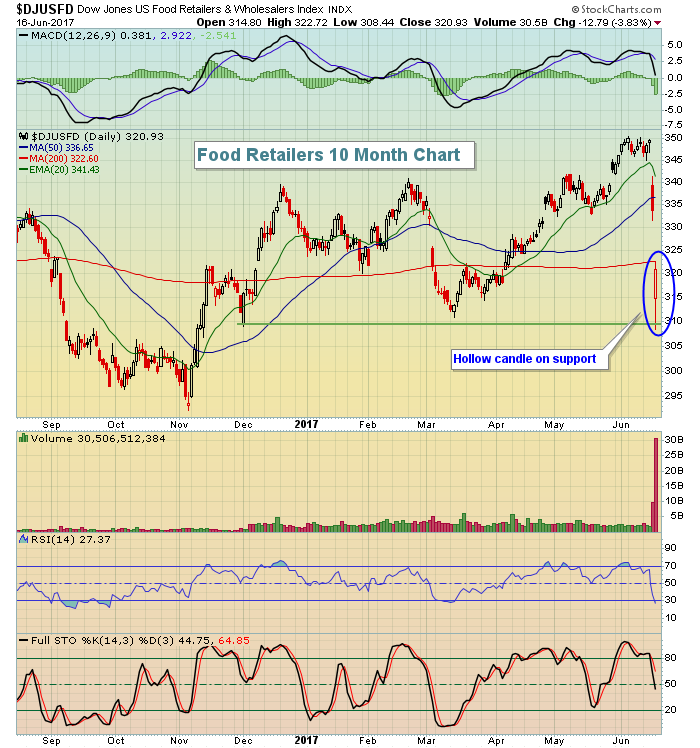
While broadline retail ($DJUSRB) survived mostly due to Amazon's strength (+2.40%), there were several in the space that struggled mightily. WMT, TGT and COST fell 4.65%, 5.14% and 7.19%, respectively. In drug retail ($DJUSRD), Walgreens Boots Alliance (WBA) and CVS Health Corp. (CVS) dropped 4.99% and 3.78%, respectively. But the most significant and all-encompassing losses were felt in food retail ($DJUSFD). Supervalu (SVU) was clobbered 14.36%. United Natural Foods (UNFI) declined nearly 11%. Kroger (KR) tumbled 9.24%.
As you might expect, consumer staples (XLP, -1.05%) was easily the worst performing sector on the session as food and drug retail weighed heavily. Despite the weakness on the DJUSFD, it did manage to finish much better than it started and also held a key multi-month support level. Check it out:
 The 309-310 support level will be very big now that price support there held on such massive volume. We'll likely see another visit to that level, but that could represent a solid reward to risk entry into the space with a tight stop in place.
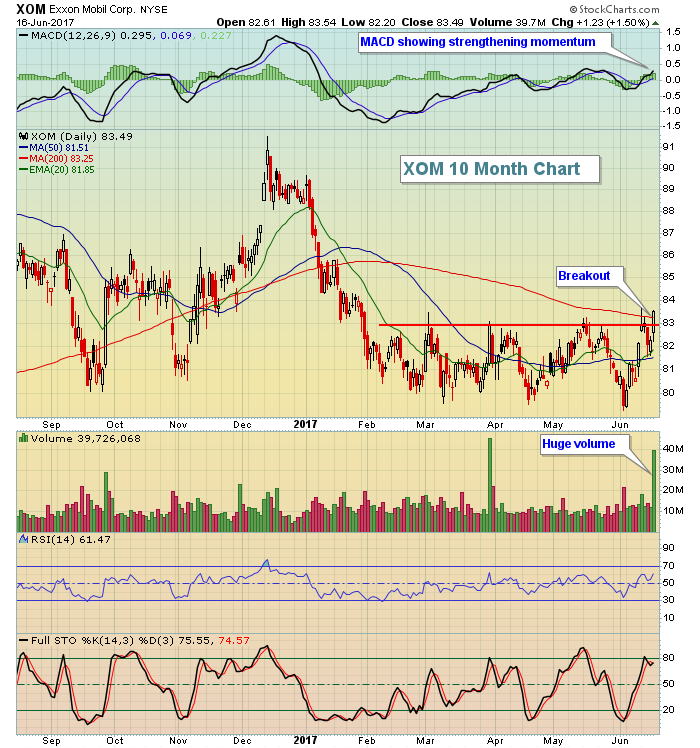
The overall market on Friday was bifurcated with both the Dow Jones and S&P 500 posting minor gains while the NASDAQ and Russell 2000 dropped. Energy (XLE, +1.65%) was the outright leader as it was able to reverse what appeared to be another losing week. Exxon Mobil (XOM) was finally able to break above key price resistance at 83 and did so on exceptionally heavy triple-witching volume. More on XOM below in the Current Outlook section.
Pre-Market Action
It's going to be a very light week in terms of earnings and there's really not an economic report of significance until Wednesday when the latest existing home sales report is released. Traders will be focused on the current trading range, global stock performance and the ability of technology stocks here in the U.S. to rebound.
Global markets are strong to open the week. In Asia, the Hang Seng Index ($HSI) rose another 300 points, while in Europe, the German DAX ($DAX) has climbed over 100 points. There's been a disconnect recently between the XLE and crude oil prices ($WTIC) as the latter has hovered near 2017 lows, while the XLE is up 3-4% off its earlier June low. Crude oil prices this morning are fractionally higher, hoping to aid the rebound in energy stocks.
With 45 minutes to go to the opening bell, Dow Jones futures are higher by 72 points, with NASDAQ futures much stronger.
Current Outlook
Exxon Mobil (XOM) had been teetering between breakout at 83 and breakdown below 79-80 for nearly all of 2017. It finally saw a major breakout on Friday with very heavy volume and is poised for further gains technically. Check out this chart:
 The breakout on the largest energy company in the world certainly won't hurt the XLE, where XOM is the largest component, making up more than 24% of the XLE performance. Chevron (CVX) and Schlumberger (SLB) represent another 24% of the XLE. CVX is on the verge of its own 3 month breakout after Friday, while SLB is printing a powerful positive divergence. The XLE, at least based on its top components, is in its best technical shape in quite some time.
Sector/Industry Watch
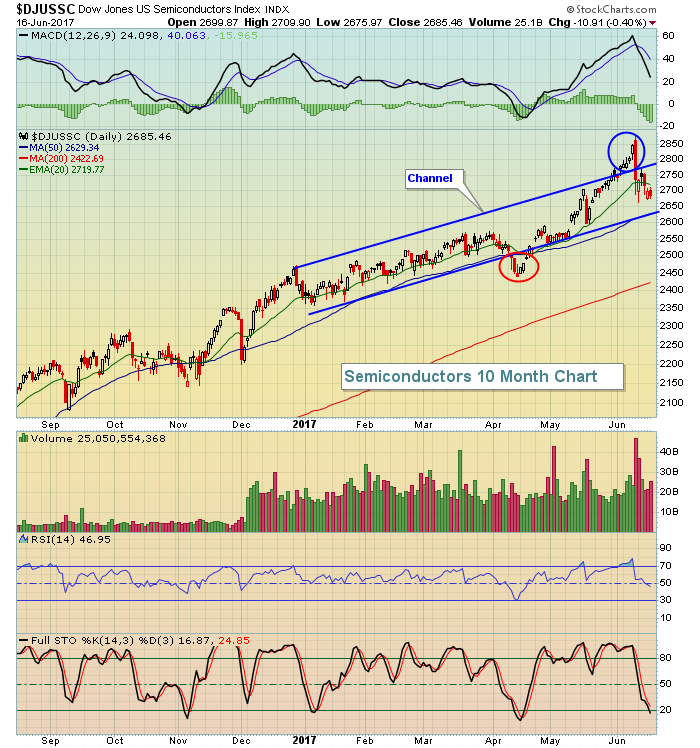
Semiconductor stocks ($DJUSSC) can be extremely volatile at times and we've seen parabolic-type moves to the upside and stomach churning moves lower, but the chart below shows that the DJUSSC has mostly traded in a nice channel throughout 2017 and is currently within that channel despite the significant profit taking in June. Volume to the downside has been heavy, but there's been panic by those who chased the performance here and entered at price points that nearly challenged the 2000 highs earlier this month. Here's the chart:
 NASDAQ futures are up nicely this morning. It'll be interesting to see whether the DJUSSC returns to a leadership role or whether the last several days of profit taking kicks in again.
Monday Setups
Every Monday, I look to find a solid reward to risk setup (on the long side since we remain in an established bull market). Then I typically add several more potential trade setups during my Monday MarketWatchers LIVE show that begins at noon EST. You can CLICK HERE after 11:45am EST to join the show by clicking the "On Air" button and following the instructions. The On Air button will not appear on this page until 11:45am.
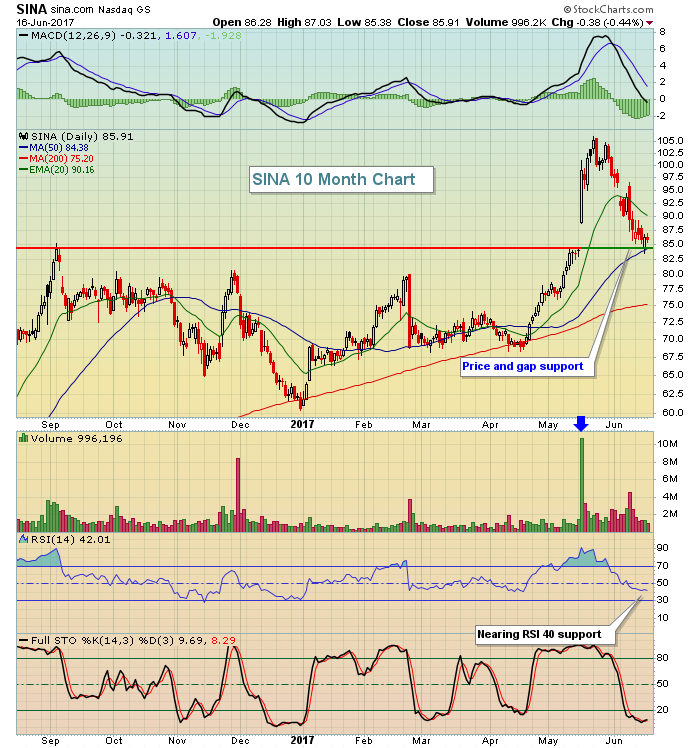
Today, I like sina.com (SINA), which has fallen close to 20% and returned to a key gap support level. While SINA is extremely volatile and not for risk averse traders, it does provide a solid reward to risk at its current price should gap support hold and the stock begin to head back towards its recent high close to 105. Check out the chart:
 Consider a closing stop in the 82.50-83.00 area with an eventual target of 105.00. That's about a 5 to 1 reward to risk ratio, which is quite solid.
Historical Tendencies
While futures today are bright, Mondays that fall between the 18th and 26th of calendar months tend to be very bearish. Mondays are bearish in general, but those that fall within the bearish 18th to 26th calendar month period are especially bearish. Mondays have produced negative annualized returns on each calendar day during that period, with a couple of days producing very large annualized losses.
Mondays don't always move lower, however. They move lower approximately 40% of the time since 1950 during that 18th to 26th period.
Key Earnings Reports
None
Key Economic Reports
None
Happy trading!
Tom
