Market Recap for Thursday, May 11, 2017
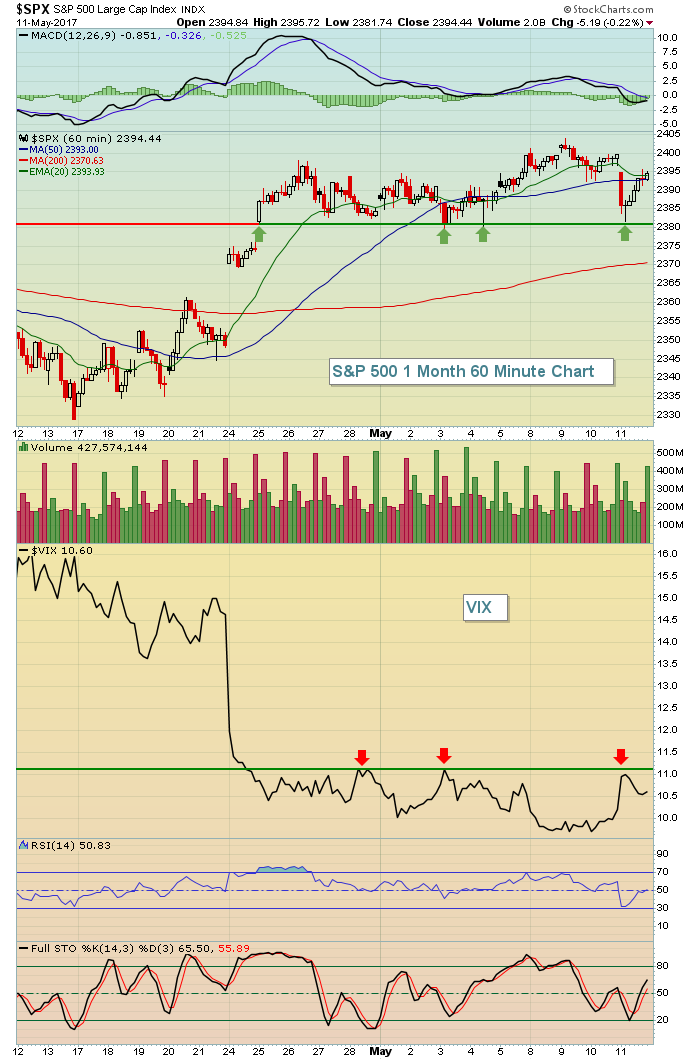
Consumer staples (XLP, +0.15%) and utilities (XLU, +0.14%) were beneficiaries of money rotating more defensively on Thursday. While the end result at the close wasn't bad overall (the Dow Jones and S&P 500 lost 0.11% and 0.22%, respectively), the losses earlier in the session were as significant as any we've had in nearly a month. The Volatility Index ($VIX) was up approximately 10% at the S&P 500's intraday low as you can see below:
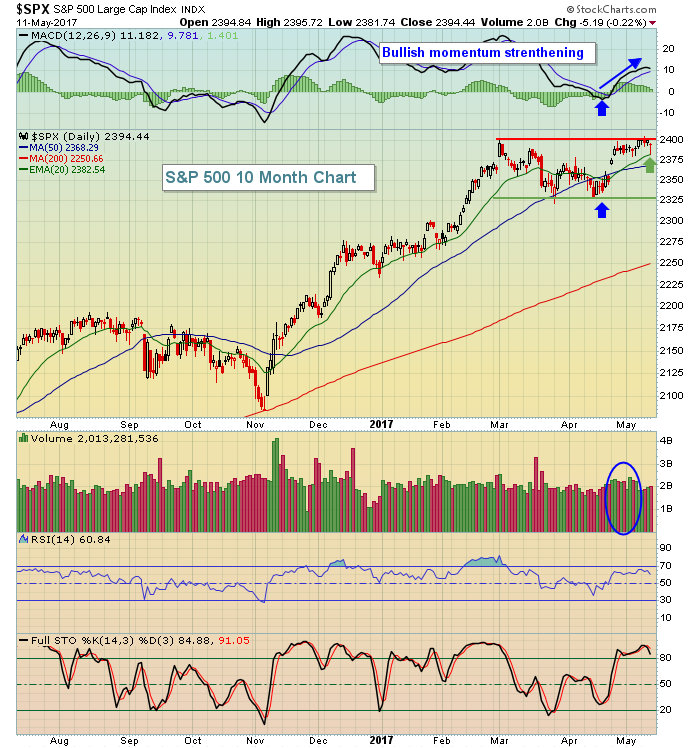
 The benchmark S&P 500 found buyers almost exactly where you'd expect given the gap and price support from lows over the past few weeks. Simultaneously, the VIX was bumping against overhead resistance just above 11. Those who are looking for lower S&P 500 prices should pay close attention to these levels - S&P 500 at 2380 and VIX at 11.10. A move below 2380 on the S&P 500 accompanied by a short-term breakout in the VIX would likely lead to additional weakness in U.S. equities. However, the next chart on the S&P 500 shows that we had a very ordinary test of moving average support during yesterday's session and that a further rise ahead is the more likely scenario. Have a look:
 The green arrow marks the 20 day EMA test from yesterday. This daily view highlights the sideways consolidation that the S&P 500 has been experiencing since topping on March 1st. The current range is from roughly 2325-2400. If the S&P 500 loses the recent 2380 price and gap support that was reflected on the first chart, there will still be many levels to watch for down to that key 2325 area. That's why, in my opinion, the bulls remain in complete control of the action here. As long as 2380 price support holds, that MACD is suggesting to me that bullish momentum is accelerating and I'd look for a clear breakout above 2400.
Pre-Market Action
Treasuries are of interest this morning with the 10 year treasury yield ($TNX) falling 5 basis points to 2.35%. Lower than expected April retail sales (+0.4% vs +0.6%) are helping to keep a lid on treasury yields and will likely put a damper on that part of discretionary stocks as well.
Asian stocks were mixed overnight while European stocks are fractionally higher. That mild strength in Europe is not carrying over to U.S. equities, however. Traders here are focusing on short-term price support and another disappointment out of the retail area as Dow Jones futures are lower by 5 points with 30 minutes left to the opening bell.
Current Outlook
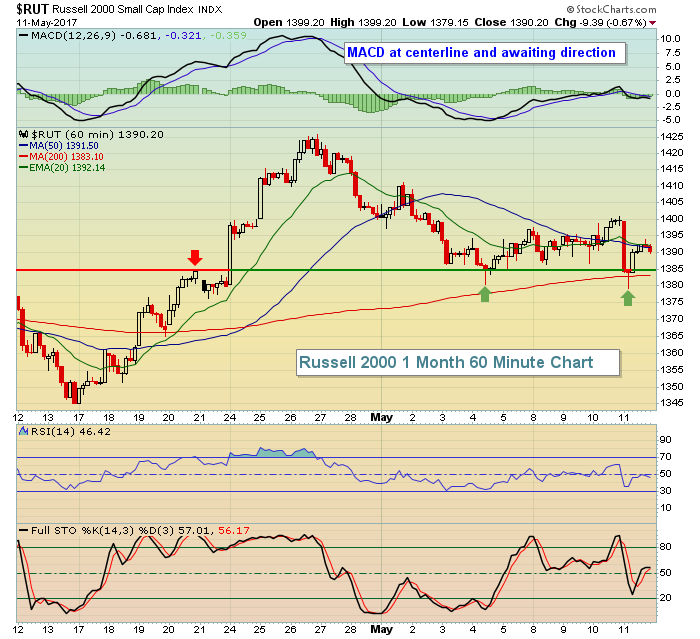
The Russell 2000 hit key price support in the 1380-1385 range and printed a nice reversing candle yesterday, matching the one that printed a week earlier. Here's the visual:
 We could begin to see selling accelerate if the S&P 500 loses 2380 support and the Russell 2000 loses 1380 support. But we're in a bullish pattern so I'm going to stick with my belief that we'll see a breakout before a breakdown.
Sector/Industry Watch
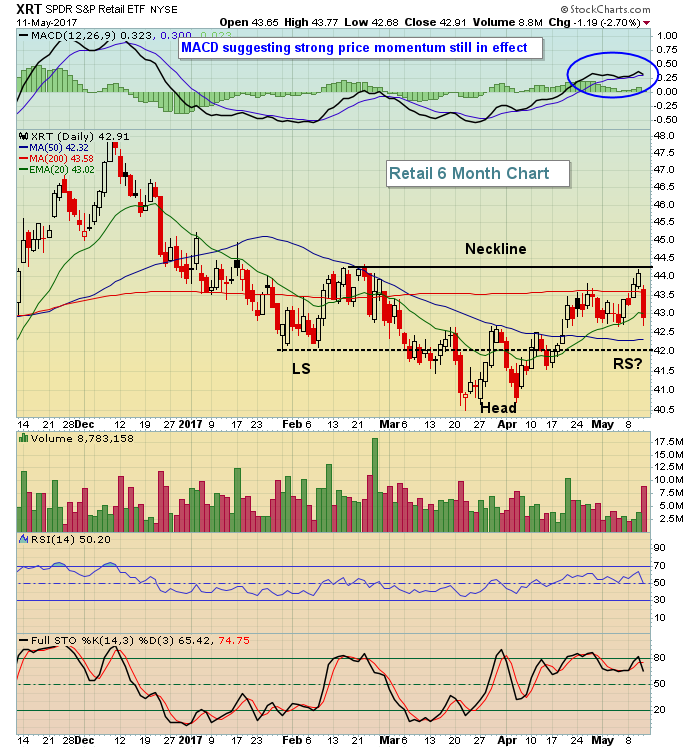
A number of retail stocks were trashed on Thursday, including Kohls (KSS, -7.84%) and Nordstroms (JWN, -7.60%) in the apparel retail ($DJUSRA) space. Also, several of the broadline retailers ($DJUSRB) like Dillards (DDS, -17.50%) and Macy's (M, -17.01%) were hit very hard as well. Earnings were the culprit in several cases and today the group faces the latest monthly retail sales report. The S&P Retail ETF (XRT) is in a rather precarious position technically and it's an ETF that owns a basket of retail stocks - none of which that have a very large representation. The largest holding (FIVE) represents just 1.36% of the ETF so it's an all-encompassing look at retail. This is how the ETF looks right now:
 While there are solid stocks in retail including the likes of Amazon.com (AMZN), Netflix (NFLX) and Best Buy (BBY), the overwhelming majority are holding back consumer discretionary stocks (XLY), which has otherwise been very strong of late.
Watch the potential reverse head & shoulders pattern above. The XRT is in a key 42.00-44.30 trading range within this pattern and a breakout above 44.30 would be very bullish and add to the relative strength in discretionary stocks.
Historical Tendencies
The next few days are historically bullish on the NASDAQ (since 1971) as you can see below:
May 12th (today): +79.82%
May 15th (Monday): +23.01%
May 16th (Tuesday): +46.53%
Those percentages represent the average annual return for each calendar day since 1971. Perhaps we'll see strength in U.S. equities over the next few days to follow historic norms.
Key Earnings Reports
(actual vs. estimate):
MT: .33 vs .21
Key Economic Reports
April CPI released at 8:30am EST: +0.2% (actual) vs. +0.2% (estimate)
April Core CPI released at 8:30am EST: +0.1% (actual) vs. +0.2% (estimate)
April retail sales released at 8:30am EST: +0.4% (actual) vs. +0.6% (estimate)
April retail sales less autos released at 8:30am EST: +0.3% (actual) vs. +0.5% (estimate)
March business inventories to be released at 10:00am EST: +0.1% (estimate)
May consumer sentiment to be released at 10:00am EST: 97.3 (estimate)
Happy trading!
Tom
