Market Recap for Friday, April 28, 2017
Equities sold off throughout the day on Friday, but no significant levels of support were lost. Starbucks (SBUX) jolted the market a bit, gapping down to test its rising 20 day EMA, but that support level held and while the internet group ($DJUSNS) may have found a short-term top with a reversing shooting star candle, the longer-term technicals are quite strong. Here's a quick glimpse at both the DJUSNS and SBUX after Friday's action:
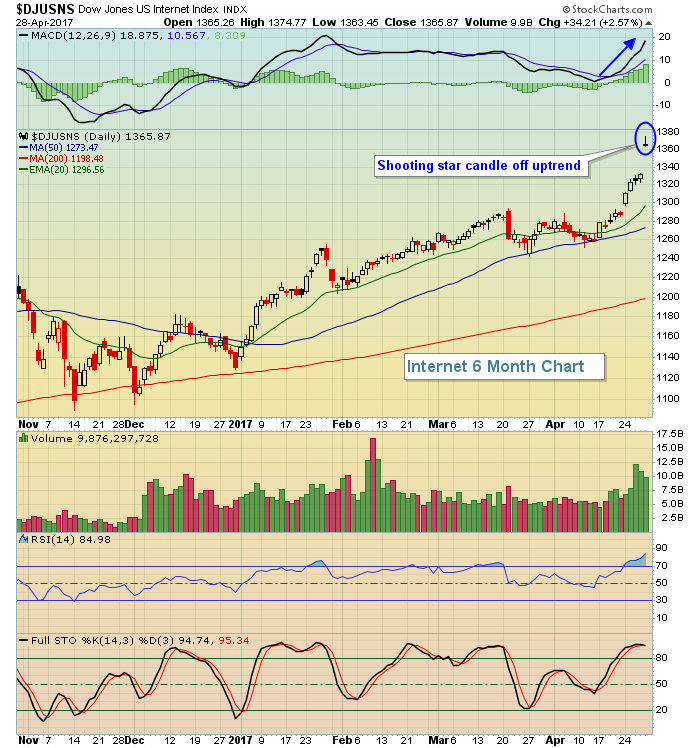 .....and now the discretionary SBUX:
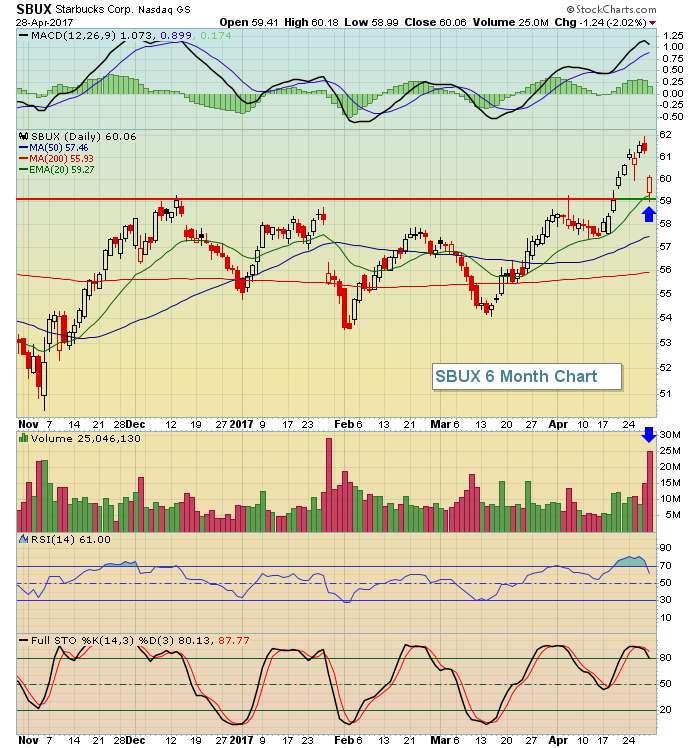 SBUX managed to hold onto both price and 20 day EMA support, while doing so on extremely heavy volume. I expect SBUX to trend higher from here.
Pre-Market Action
It's been a quiet morning thus far in Europe and Asian markets were mixed and fairly flat as well. Here in the U.S. the Dow Jones futures are up roughly 35 points with 30 minutes left before the opening bell.
Current Outlook
The S&P 500 nearly touched key price resistance before turning down on Friday. However, we have seen a couple of short-term breakouts to the upside on the S&P 500 the past week or so. Take a look:
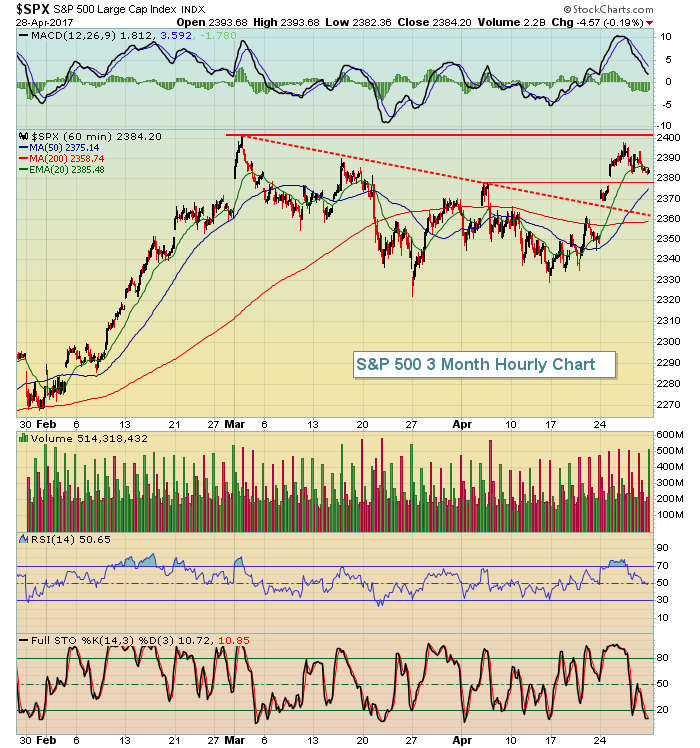 Just above 2400 is the obvious level to watch as it represents an all-time high. To the downside, keep an eye first on a range of support in the 2375-2380 area.
Sector/Industry Watch
Commercial vehicles & trucks ($DJUSHR) broke out early last week on increasing volume, suggesting that another move to the upside is likely underway. Here's the visual:
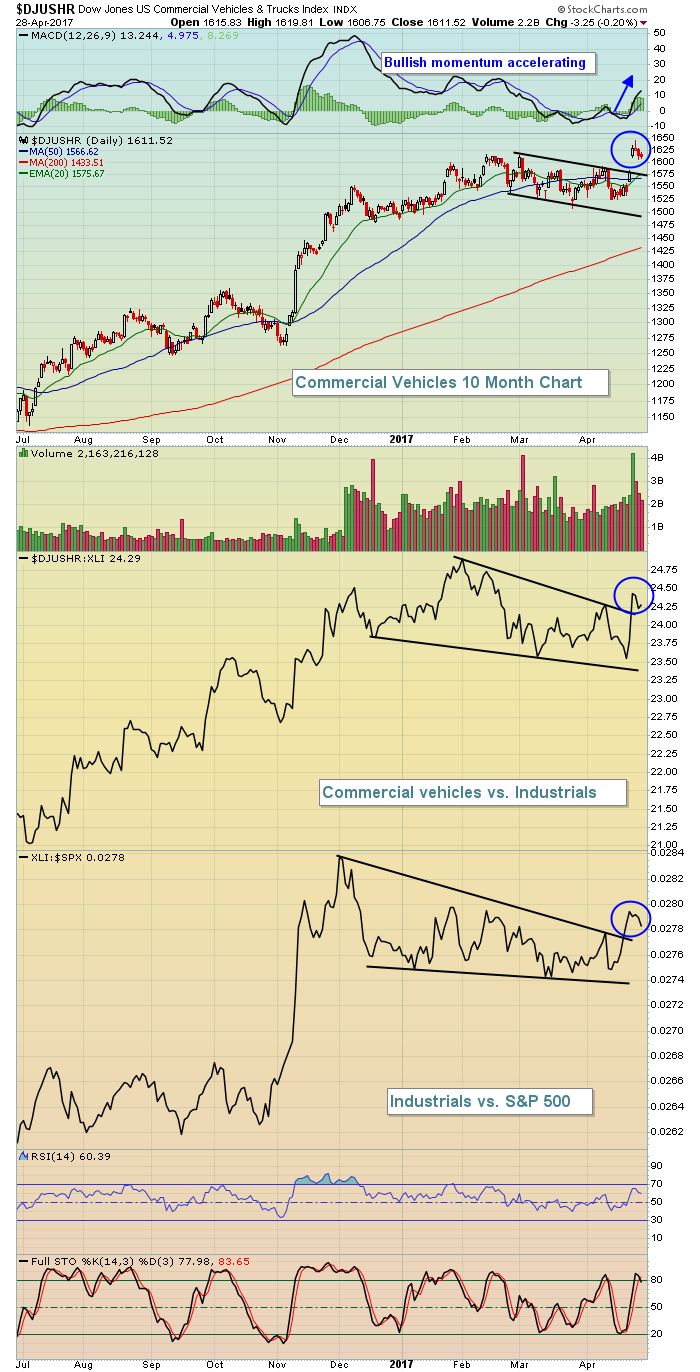 In addition to an absolute breakout in price last week, it appears that the DJUSHR:XLI has broken out of a bullish relative wedge amongst its industrial peers. Furthermore, the industrials (XLI) has also broken out of a continuation bullish relative wedge vs. the benchmark S&P 500. Based on the confluence of bullish factors, the DJUSHR is a solid industry group to look for strength over the coming days and weeks.
Monday Setups
ABB Ltd (ABB) surged last week and is now on the verge of reaching its all-time high of 24.68. Friday's high of 24.63 came within a nickel and given the very bullish long-term ascending triangle pattern, I believe it's just a matter of time before we get a bullish breakout here. Take a look at the chart:
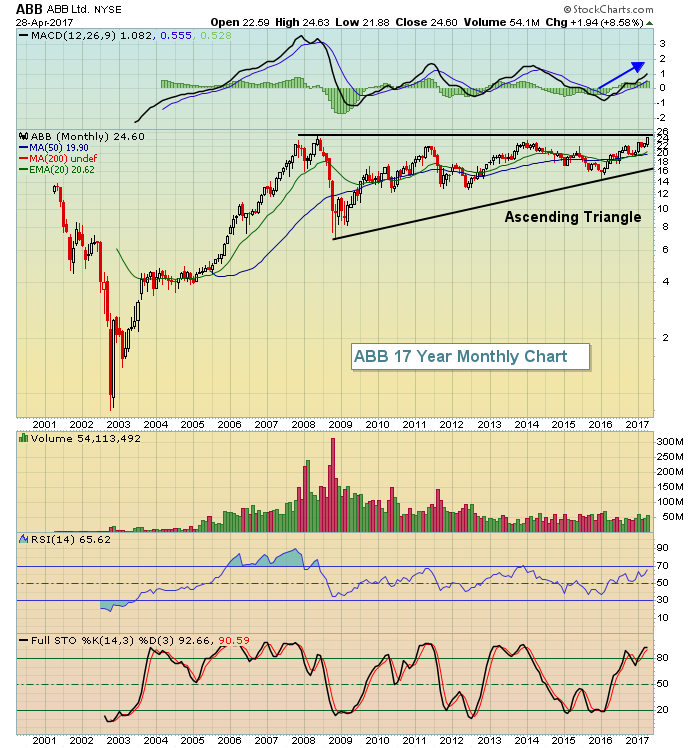 Long-term momentum is very strong although ABB could use more volume as it makes its breakout. Additional setups will be featured during the MarketWatchers LIVE show that airs later today at noon EST. Both Erin Heim and I will be sharing setups for the week so please plan to join us. The setups are typically discussed in the first 15-20 minutes of the show. As the show begins, you'll be able to click on the "On Air" button that appears when you're on the site OR you can follow THIS LINK at noon.
Historical Tendencies
The NASDAQ typically gets off to a very fast start in May. Here are the annualized returns by day for the NASDAQ since 1971:
May 1st: +99.87%
May 2nd: +57.56%
May 3rd: -27.55%
May 4th: +44.02%
May 5th: +79.96%
Key Earnings Reports
(actual vs. estimate):
CAH: 1.53 vs 1.46
DISH: .76 vs .67
L: .87 vs .76
(reports after close, estimate provided):
AMD: (.07)
SBAC: .22
VNO: 1.25
Key Economic Reports
March personal income released at 8:30am EST: +0.2% (actual) vs. +0.3% (estimate)
March personal spending released at 8:30am EST: +0.0% (actual) vs. +0.1% (estimate)
April PMI manufacturing index to be released at 9:45am EST: 52.8 (estimate)
April ISM manufacturing index to be released at 10:00am EST: 56.5 (estimate)
March construction spending to be released at 10:00am EST: +0.5% (estimate)
Happy trading!
Tom
