Market Recap for Tuesday, May 2, 2017
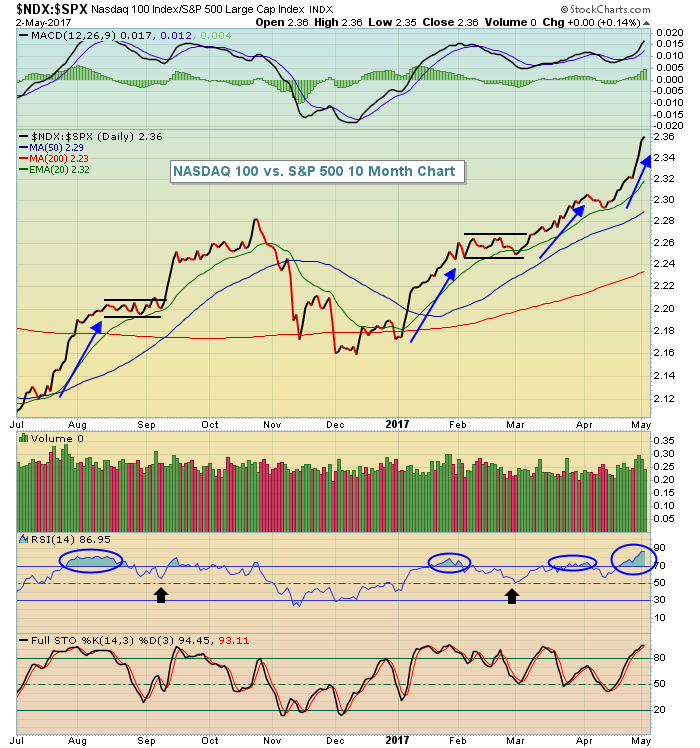
Traders weren't overly impressed with Apple's (AAPL) quarterly report last night and NASDAQ futures are suffering this morning. However, the NASDAQ 100 ($NDX) has been significantly outperforming the benchmark S&P 500 for months and a bit of relative weakness would not be a bad thing at all. The following chart shows how the NDX has performed vs. the SPX over the past 10 months:
 The NASDAQ 100 represents the 100 largest non-financial stocks on the NASDAQ. It's an agressive large cap index and outperformance of the NASDAQ 100 vs. the S&P 500 is typically a sign of a sustainable bull market as it reflects money rotating to riskier assets. I've highlighted the long-term relative performance and how it relates to absolute S&P 500 performance in the Current Outlook section below.
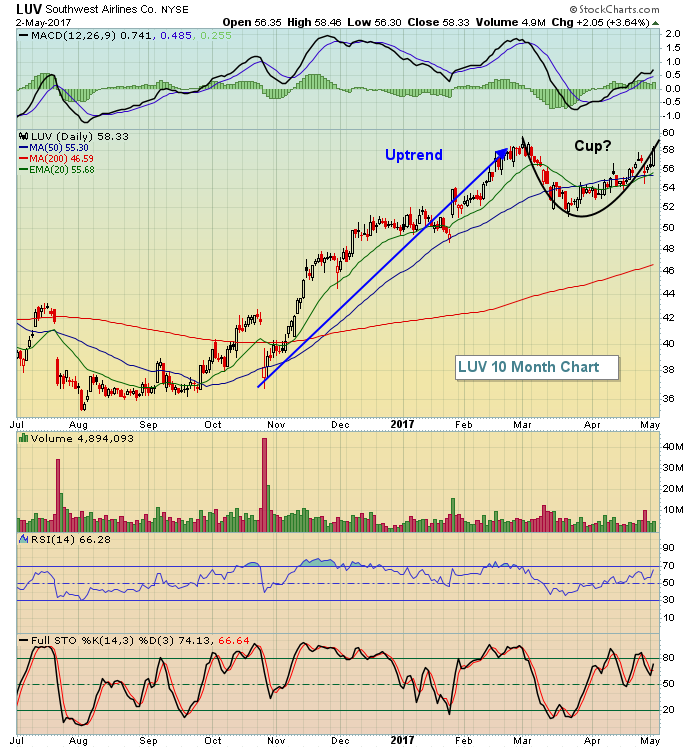
There was bifurcated sector action with industrials (XLI, +0.48%) leading equities higher on the heels of a very strong airlines group ($DJUSAR), which rose more than 4% on the session. Southwest (LUV) appears to be one of the best looking charts in the group, potentially forming the right side of a cup after testing and holding price support. Check it out:
 Hesitation in the 59-60 area would represent the right side of a cup. Then a handle to consolidate recent gains would set this stock up beautifully for a potential breakout, followed by another rally.
Pre-Market Action
Apple's (AAPL) disappointment will get stocks off to a rough start this morning, especially on the tech-laden NASDAQ. ADP employment came in above expectations so I'll be interested to see how the 10 year treasury yield ($TNX) responds.
Currently, Dow Jones futures are lower by 19 points as we approach the opening bell.
Current Outlook
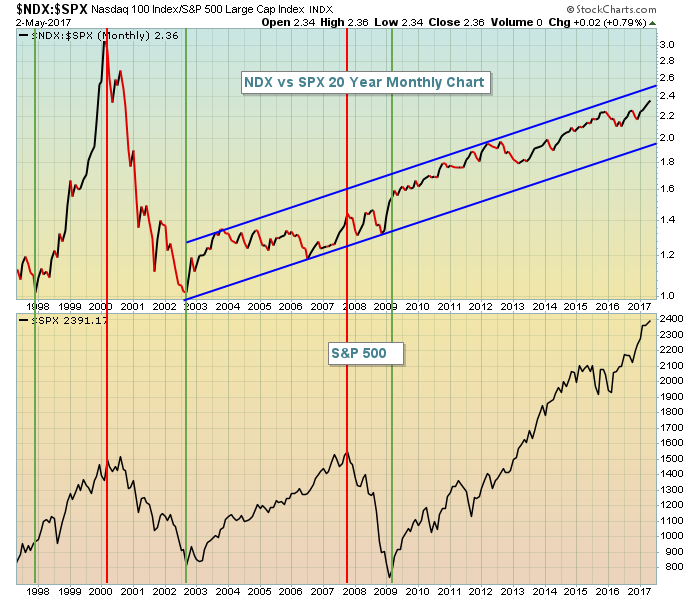
One key ingredient in any sustainable bull market is traders' appetite for riskier investments. When the stock market turns defensive and the Volatility Index ($VIX) turns higher, a bear market environment can thrive and technical selling can begin. Currently, the VIX is in the 10s, not a level where bear markets have historically begun. Furthermore, you can get a long-term historical view of how the S&P 500 performs during periods of NDX:SPX relative strength and weakness. Check it out:
 You can see that the direction of the S&P 500 is tied to the relative performance of the NDX:SPX. The only exception was during the 2007 to 2009 bull market, which is explained by the fact that this bear market was induced by a financial system meltdown and the NDX ignores financial-related stocks. The ratio continues to surge and that's a sign of additional gains in U.S. equities in my view.
Sector/Industry Watch
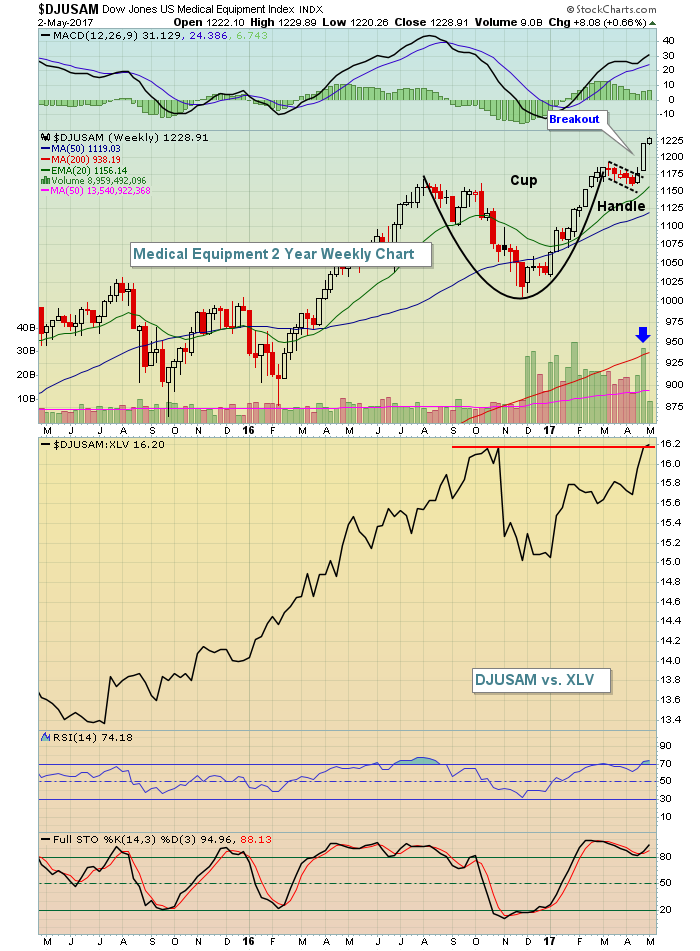
The Dow Jones U.S. Medical Equipment Index ($DJUSAM) has recently broken out of a bullish cup with handle pattern and it's also leading the healthcare (XLV) industry higher. Take a look at the current technical view:
 Check out the volume and how it (blue arrow) confirms the breakout above cup resistance and just after the handle formed. The group is overbought so a pullback to what now is cup support near 1190 would likely offer up some quality entry points in stocks within the industry.
Historical Tendencies
Wednesdays through Fridays have historically been the best calendar days of the week for the bulls, far exceeding performance of Mondays and Tuesdays.
Key Earnings Reports
(actual vs. estimate):
ADP: 1.31 vs 1.23
NVO: .58 vs .53
RAI: .56 vs .57
S: (.07) vs (.04)
SO: .66 vs .58
TWX: 1.66 vs 1.44
(reports after close, estimate provided):
AIG: 1.11
FB: .88
KHC: .85
MET: 1.27
PRU: 2.64
TSLA: (.67)
Key Economic Reports
April ADP employment report released at 8:15am EST: 177,000 (actual) vs. 170,000 (estimate)
April PMI services index to be released at 9:45am EST: 52.3 (estimate)
April ISM non-manufacturing index to be released at 10:00am EST: 55.8 (estimate)
Happy trading!
Tom
