Special Announcement
I'm very excited to announce the beginning of our new StockCharts.com show featuring me and Erin Heim. We'll have fun covering the global markets, discussing stocks on the move, providing technical analysis education and highlighting the various tools available here at StockCharts, among other subjects. The show is FREE and you don't need to register for the event or download any software. Simply click on the button that will be provided on SharpCharts and other pages and join the show! We'd love to see you!
To watch today's show, CLICK HERE.
Market Recap for Friday, March 31, 2017
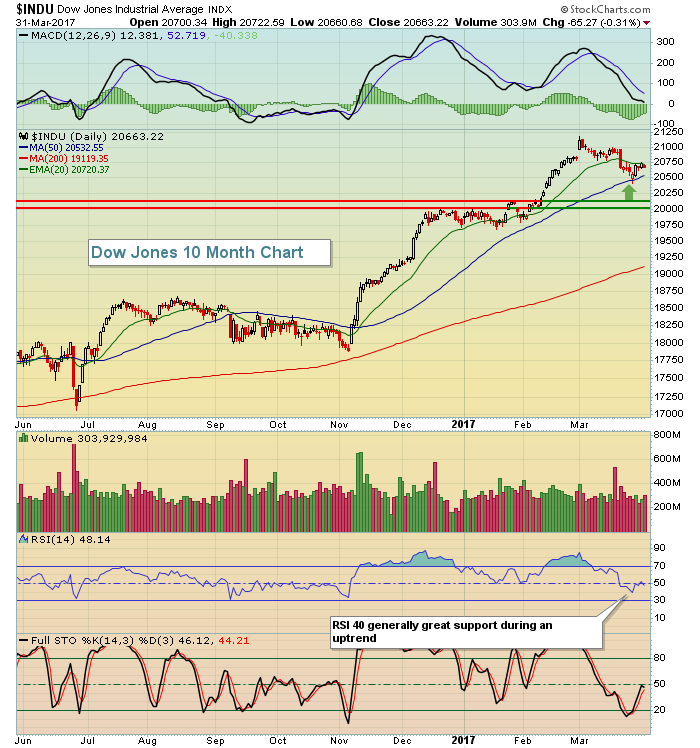
The Russell 2000 managed to finish with gains on Friday despite late day selling in U.S. equities that carried the other major indices into negative territory. Overall, however, stocks performed very well last week, holding onto key areas. In the Current Outlook section below, I've featured a daily chart of the Dow Jones showing the kick save off its 50 day SMA at a time when its daily RSI hit 40 for the first time since the latest bull market rally began in November 2016.
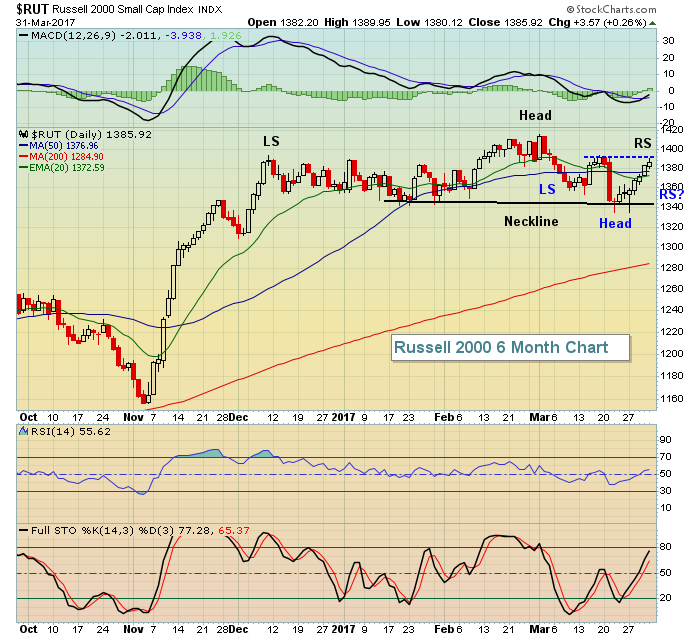
The Russell 2000 has quietly gained the past seven trading sessions as money rotates toward small caps - a bullish development. The Russell looks to be printing an inverse head & shoulders on its daily chart but we'll need to see if the pattern completes itself. Here's what to look for:
 So is the glass half full or half empty? Technical analysis is in the eyes of the beholder. Are we topping in a head & shoulders pattern (black annotations)? Or is this a bullish inverse head & shoulders continuation pattern (blue annotations)? I believe the latter, but we'll see. Just keep in mind that a confirmed close below 1340 would certainly support the more bearish outlook.
Utilities (XLU, +0.39%) led the market on Friday, although it was not a great week for defensive stocks. Energy (XLE, -0.34%) was weak on Friday, but did manage to lead the action last week among sectors.
Pre-Market Action
Asia was higher overnight, while Europe is mixed this morning. Dow Jones futures are pointing to a slightly higher open, +12 points as we head into a fresh trading week.
Current Outlook
The Dow Jones was very overbought to begin March, but that's not the case as we begin April. After March 1st, we saw U.S. equities turn lower throughout the balance of the month before finally resuming their uptrend last week. The good news is that the three lagging sectors last week were all the defensive groups with utilities (XLU, -1.12%) and consumer staples (XLP, -0.22%) while leadership came mostly from areas where we want to see leadership. Here's the current look at the Dow Jones:
 20400 should provide initial support, while a much bigger area of support resides near the 20000 level.
Sector/Industry Watch
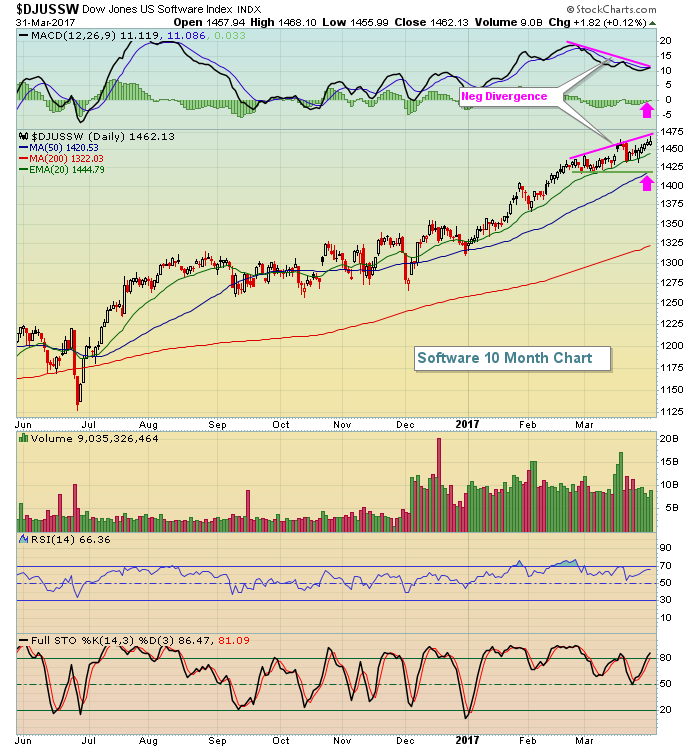
Technology has continued to perform well, but components could be in for some rough trading in the days and weeks ahead - or maybe not. That's simply how the market works. But there are warning signs. Take, for instance, the Dow Jones U.S. Software Index ($DJUSSW), which is showing signs of slowing momentum. Here's the chart:
 The last two price highs have been accompanied by lower MACD levels. When I see this, I look for 50 day SMA and MACD centerline tests (pink arrows).
Monday Setups
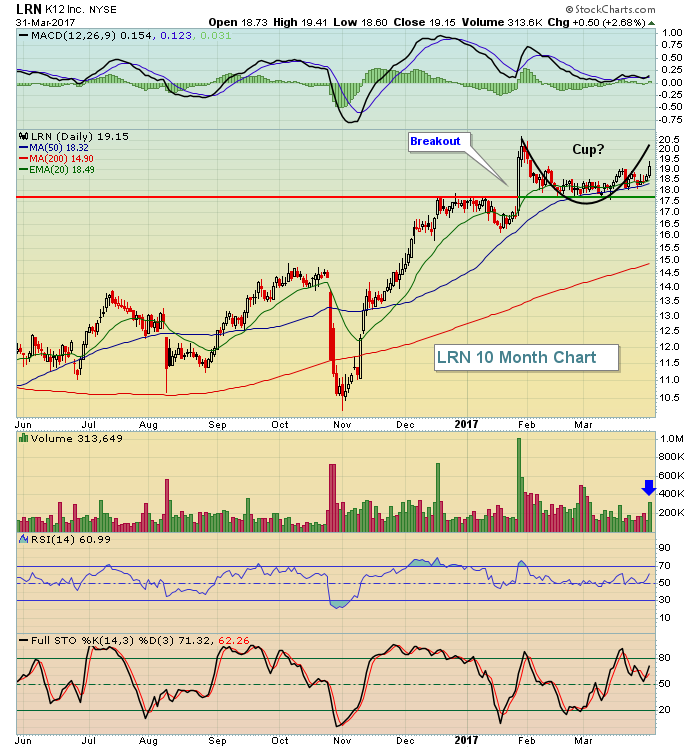
K12, Inc (LRN) will be reporting earnings in a few weeks after having posted excellent results last quarter on January 26th. After breaking out on heavy volume, LRN consolidated at support for several weeks and literally appears to have just broken out to the upside from its range of consolidation. Check it out:
 LRN looks to be filling the right side of a cup, but I also could draw an inverse head & shoulders pattern. The point is that this is a very bullish looking chart and I'd expect to see more strength into its earnings report - and then it's anyone's guess. I'll be discussing more setups in MarketWatchers LIVE at 1:10pm EST.
Historical Tendencies
April 1st to April 18th represents a very bullish historical period for the S&P 500 (all the other major indices are very bullish as well during this period). Since 1950, the S&P 500's annualized return for these 18 days is +28.77%, more than triple the S&P 500's average annual return of roughly 9%.
Key Earnings Reports
None
Key Economic Reports
March ISM manufacturing index to be released at 10:00am EST: 57.1 (estimate)
February construction spending to be released at 10:00am EST: +1.0% (estimate)
Happy trading!
Tom
