Special Note
Greg Schnell (author of The Canadian Technician blog) and I will be co-hosting a special webinar tomorrow at 11am EST. I'll discuss trading strategies with respect to gaps created by earnings reports while Greg's discussion will focus on his outlook for biotech stocks. Greg will also cover the huge advantages of creating ChartLists to organize your stock trading. It should be very educational and informative and we'd love to have you join us. It is a members only webinar, though, so if you're not a member, it's a great time to sign up for a 10 day FREE trial to gain access to the webinar and join us in the morning.
For members:
CLICK HERE to register for the event.
For non-members:
CLICK HERE to sign up for a FREE 10 day trial
Greg and I look forward to seeing you in the webinar tomorrow morning!
Market Recap for Thursday, February 9, 2017
In what has become the norm over the past few months, financials (XLF, +1.37%) once again took over sector leadership on Thursday, led by life insurance ($DJUSIL) and banks ($DJUSBK). Both of those industry groups have shown tremendous relative strength as the 10 year treasury yield ($TNX) has risen - so not much of a surprise there. But there was one group - real estate services ($DJUSES) - that bested both of them yesterday and they may continue to do so given their improving technical picture. The DJUSES had been under intense selling pressure, losing 40% of its index value over a 16 month period beginning in July 2015. While the DJUSES has recently strengthened like so many financial industry groups, it's nowhere near its all-time high, but is now just seeing its weekly MACD make a cross of centerline resistance. Prior to this strength, the DJUSES printed a positive divergence on its weekly MACD, suggesting that the downside momentum had weakened. This push to the upside could very well be in the early stages. Take a look at the weekly chart:
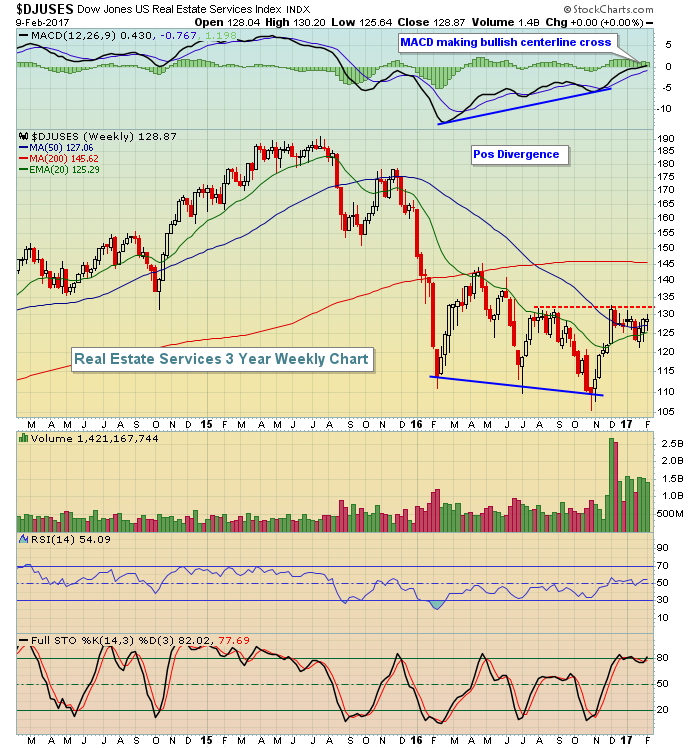 Note that the RSI has not broken above 60 during the downtrend. That's usually the case during a downtrend so I'd look for two things to further confirm the bullish outlook. First, I want to see that short-term resistance line cleared near 132. There's a bottoming reverse head & shoulders pattern in play so clearing that price resistance would confirm that bullish pattern. Then look for an RSI reading back above 60 as that too would begin to point to more strength ahead.
Energy (XLE, +1.13%) also rebounded nicely to provide leadership on Thursday as this sector bounced off a test of key gap support. Check this out:
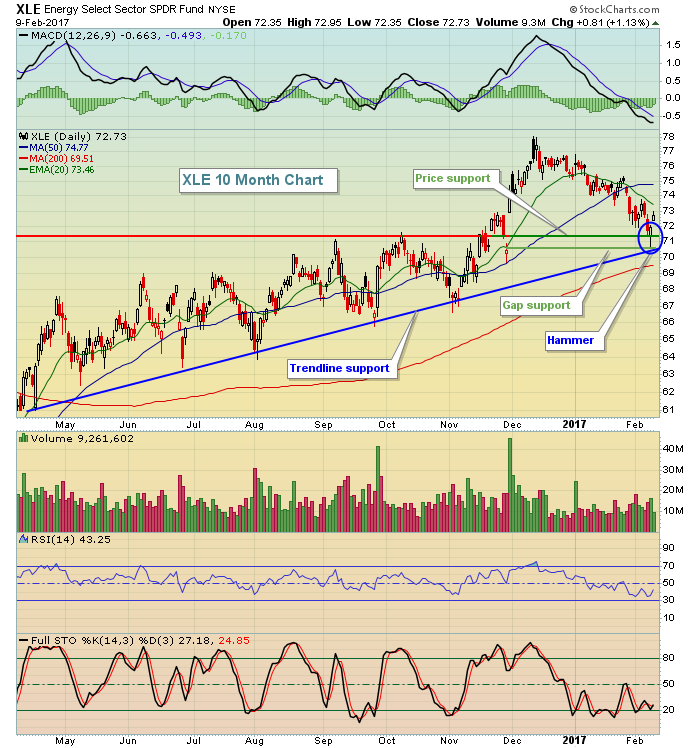 It wasn't just price support, however. There was also a reversing candlestick (hammer) that printed on gap, price and trendline support. Exploration & production stocks ($DJUSOS) have reversed at a key level on their weekly chart and I've featured that industry group below in the Sector/Industry Watch section.
Pre-Market Action
In Asia overnight, the Tokyo Nikkei ($NIKK) gained a huge 471 points, or 2.49%. That did not represent a fresh breakout, but did send the NIKK up closer to price resistance near 19600. The NIKK is currently in a very bullish symmetrical triangle pattern and a break above its short-term upper downtrend line would likely be a signal for more strengthening in the weeks and possibly months ahead.
NVIDIA Corp (NVDA), one of the strongest stocks over the past year, reported solid results again after the bell on Thursday and is looking to clear 120 price resistance. Currently, the last pre-market trade was 119.88. It's definitely a stock worth watching today as another breakout would be a great signal for the technology sector.
Dow Jones futures are higher by 30 points, looking to add to its all-time high close on Thursday. Crude oil prices ($WTIC) are up 1.74% in pre-market trade and that should help energy continue its rebound.
Current Outlook
The Dow Jones Transportation Average ($TRAN) has been consolidating in bullish sideways fashion and the key TRAN:UTIL ratio has been holding relative triangle support and is now testing a longer-term trendline support as well. The transports have been very strong during this bull market advance and are certainly one of the keys to sustaining this rally and strength in the TRAN:UTIL is a sign to expect the overall market rally to be sustained. The initial sign of failure would be a break of both triangle and trendline support on a relative basis. Here's the visual:
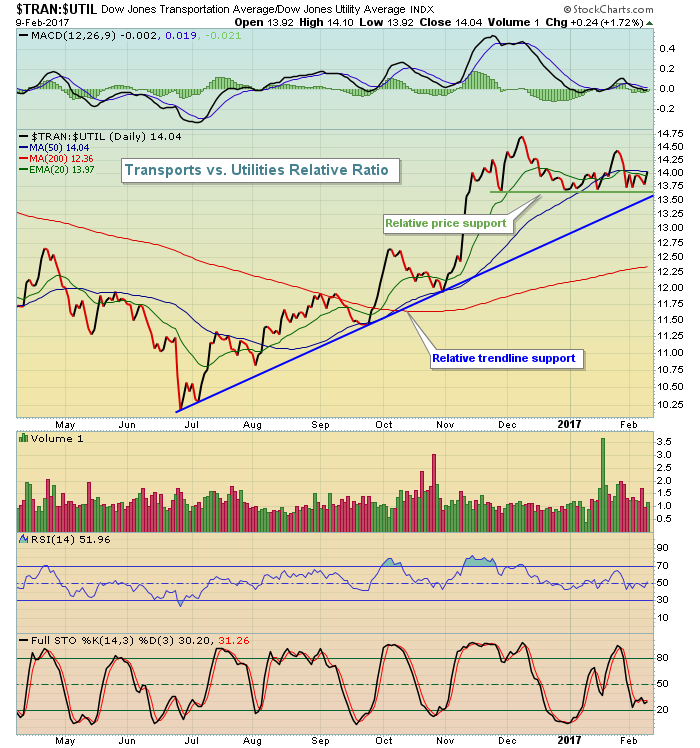 I don't want to overemphasize the above ratio. Failing to hold the key relative support levels identified would be a crack in the bullish foundation of the overall market, but it in no way would guarantee a correction or a bear market. A breakdown here would need to be evaluated in connection with other key relative ratios and, of course, major price support levels on our major indices. My guess, however, is that we'll continue to see this relative ratio move higher off of relative support.
Sector/Industry Watch
The Dow Jones U.S. Production & Exploration Index ($DJUSOS) is showing a very bullish candle for this week thus far, suggesting that its recent selling has ended and could be poised for a very solid run to the upside now. Look at the hammer that's printing (weekly candles aren't done until Friday's close) right on rising 20 week EMA support:
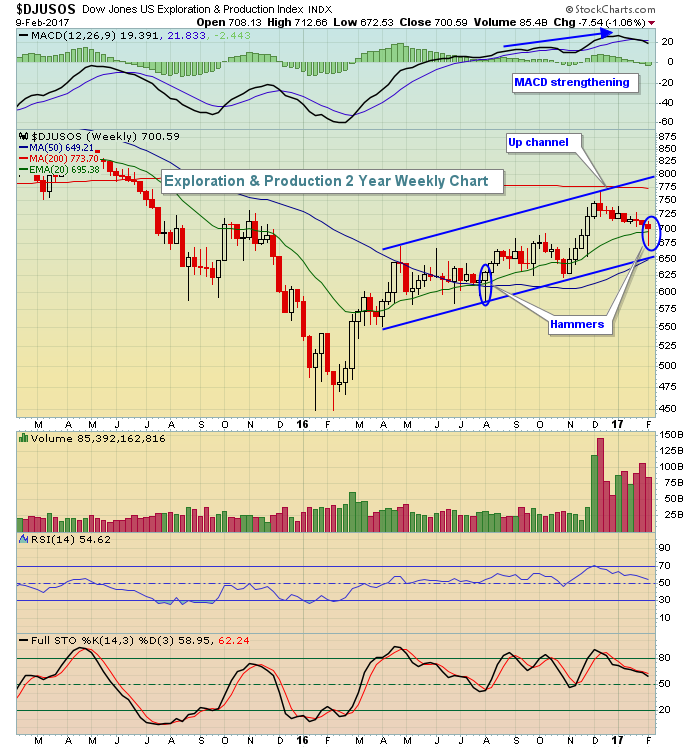 On the most recent price high, check out the higher MACD. That's an indication that momentum is strengthening as the short-term 12 week EMA is moving up faster than the longer-term 26 week EMA. That's the definition of strengthening momentum. When I see that, I look to 20 period EMAs for support - in this case the 20 week EMA. I love the hammer printing on that moving average but we do need to survive today's action with a close at or above the 20 week EMA, currently at 695.
Historical Tendencies
Based on seasonality, the weekly hammer currently printing on the DJUSOS could be a major bottom. Take a look at how this industry group performs from now through April:
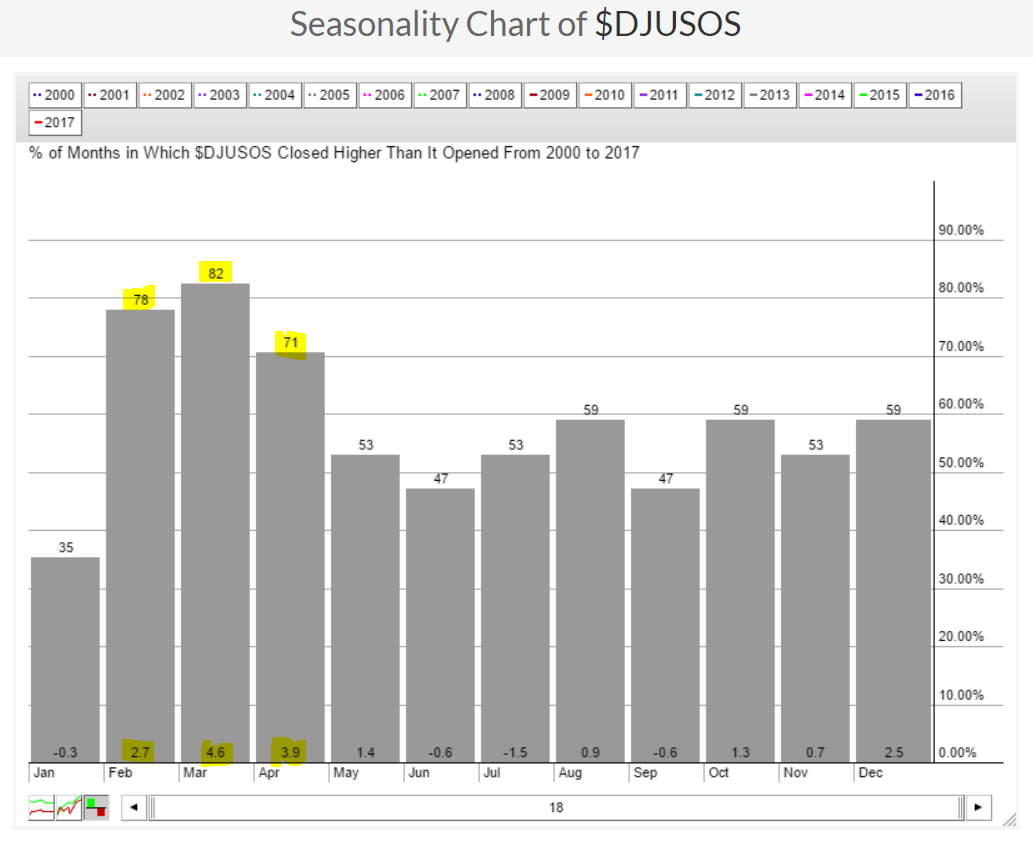 Energy tends to perform exceptionally well from February through April. It hasn't gotten off to a great start thus far, but after reaching key support levels and reversing, it now appears this could be the start of a significant move higher. The DJUSOS also tends to perform very well during this period of the year as you can see above. The fact that technical conditions are also lining up bullishly suggests we include this space as part of our trading portfolios with recent lows serving as closing stops.
Key Earnings Reports
(actual vs. estimate):
AON: 2.56 vs 2.49
AXL: .78 vs .69
CBG: .93 vs .79
IPG: .75 vs .66
MT: .16 vs .13
NTT: 1.09 (actual EPS, could not locate estimate on Zacks)
VTR: 1.03 vs 1.03
Key Economic Reports
February consumer sentiment to be released at 10:00am EST: 98.5 (estimate)
Happy trading!
Tom
