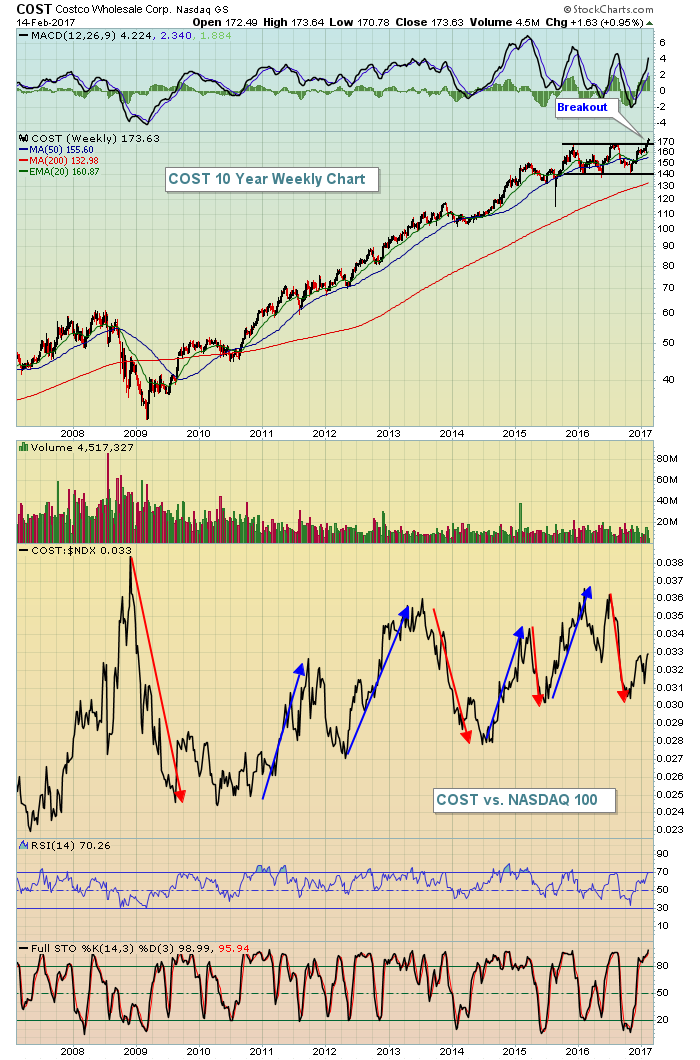
I'll return tomorrow morning with my regular Trading Places article with all the normal features. Today I simply want to point out two component stocks in the NASDAQ 100 ($NDX) that look very bullish to me. The first is Costco (COST). Basing patterns that finally breakout can lead to months or years of solid gains so I'm looking for COST to outperform the NDX in the foreseeable future. Take a look at the chart:
 While COST has been a very solid performer since the 2009 bottom, it goes through periods of strong outperformance followed by periods of significant underperformance (vs. the NDX). It appears to me that the current relative strength line is now turning higher just as COST makes a key technical price breakout. I believe that combination is going to lead to a very solid 2017 for COST shareholders.
Next up is Amazon.com (AMZN). While many stocks in the NASDAQ 100 have been breaking to new highs regularly, AMZN is quietly awaiting its turn while consolidating in a very bullish inverse head & shoulders pattern. The measurement of this pattern is 135 points - measured from the neckline to the bottom of the inverse head. Here's the chart:
 The key ingredients are all there. AMZN has a prior uptrend in place, which is necessary for a continuation pattern. The consolidation has taken place over four months after AMZN topped in early October. Since that time, the NASDAQ 100 has risen approximately 7-8%, leaving AMZN to underperform. But a heavy volume breakout to this inverse head & shoulders pattern would change that - in my opinion. The measurement of 135 points would be added to the breakout level of 845 to establish a projected target on AMZN of 980. This would represent another 15% return from current prices and I wouldn't be surprised to see that target reached in a fairly short 3-6 month time frame.
Happy trading!
Tom
