Market Recap for Friday, January 27, 2017
Last week was a milestone week for U.S. equities as the Dow Jones closed above 20000 for the first time in its history and the S&P 500 tagged 2300 for the first time as well. But that doesn't tell the whole story because following headline news can get you into a lot of trouble in the stock market. It's not the index number that we need to watch, it's the leadership that we need to watch most closely. Four sectors actual fell last week, but they were the three defensive groups - utilities (XLU, -0.51%), consumer staples (XLP, -0.38%) and healthcare (XLV, -0.13%). The other weak sector - energy (XLE, -0.42%) - is not among our aggressive sectors, although I do expect energy to perform well over the coming months due its strong historical results during the months from February through April. I wrote about historical relative strength among sectors in an article earlier this month. CLICK HERE to see that article. Also, look below under the Historical Tendencies section as I've summarized this historical relative strength on a seasonal chart here at StockCharts.com. Here's how the XLE looks technically as it approaches its strong historical period:
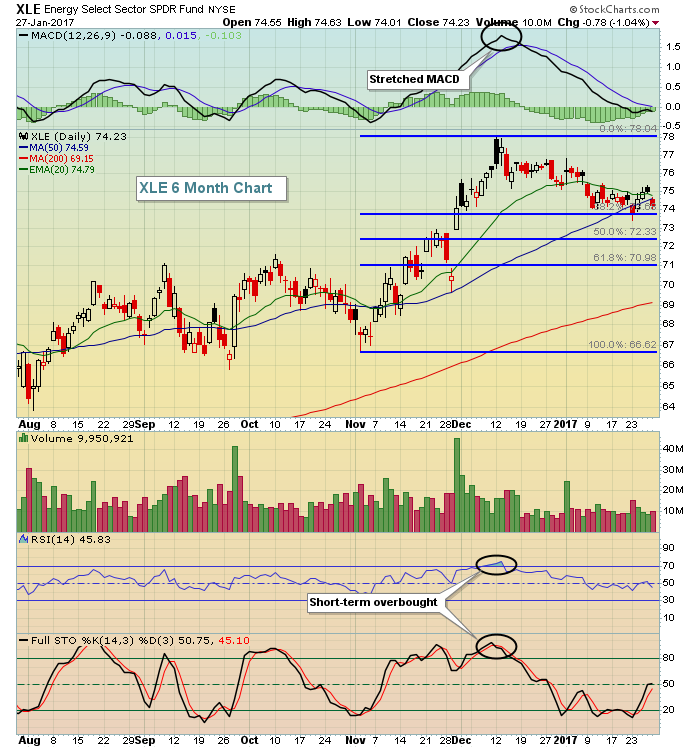 Energy was very overbought in December and momentum (MACD) was very stretched. While the recent weakness may be frustrating to those in the energy sector right now, this weakness is a positive development technically as the MACD now resides near centerline support and the RSI is at 45, a much more palatable area for entry.
After a month of consolidation, the Dow Jones U.S. Semiconductor Index ($DJUSSC) broke out again on Friday and that helped technology (XLK) lead the stock market higher, especially the NASDAQ and NASDAQ 100 indices. Here's the current outlook for semiconductors:
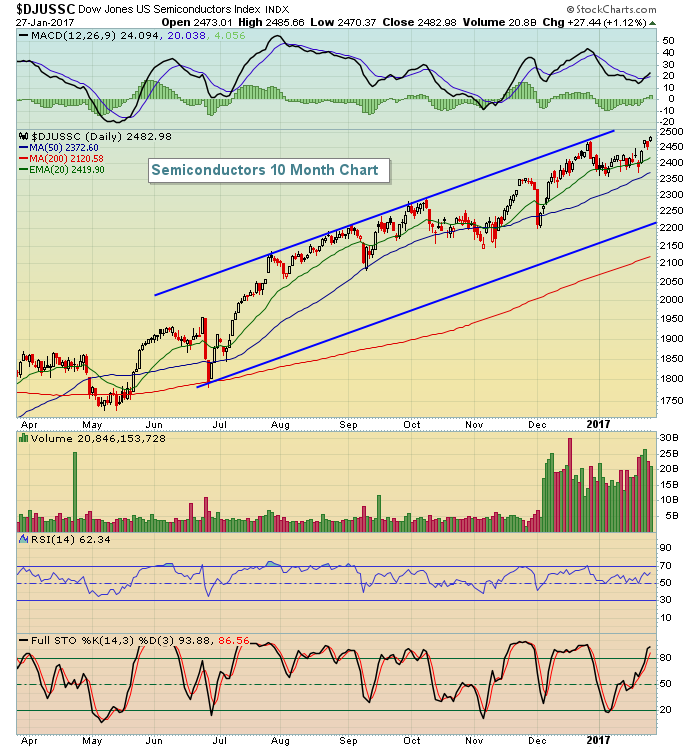 The good news is that when semiconductors move up, they tend to move up in a hurry and many times remain technically overbought. The bad news is that I eventually see the above up channel being tested to the downside. It may not happen for awhile, but it's likely to happen. Historically, the DJUSSC tends to perform well through May, but the summer months can be extremely bearish. So I'm okay with the industry for now....until we begin to see technical price breakdowns.
Pre-Market Action
Global markets are mostly lower as a new trading week begins. Crude oil ($WTIC) is flat and gold ($GOLD) is bouncing slightly after a rough week of trading. Personally, I believe the previous rally in gold has ended. I'd re-evaluate that if gold manages to close back above 1220.
Dow Jones futures are down 65 points with a little more than 30 minutes left to the opening bell and treasury prices are mostly flat.
A number of key earnings reports will be out this week, especially among the NASDAQ 100 companies.
Current Outlook
Transportation stocks ($TRAN) have steadily been outperforming utility stocks ($UTIL) and that relative relationship can be plotted on StockCharts by using the ratio "$TRAN:$UTIL". When this ratio is rising, it suggests that traders are looking for the more aggressive transportation stocks to outperform. That occurs when our economy is strengthening or is expected to strengthen. A rising ratio tells me the bull market advance is sustainable. Take a look at this long-term relationship between the S&P 500 advance and this rising ratio:
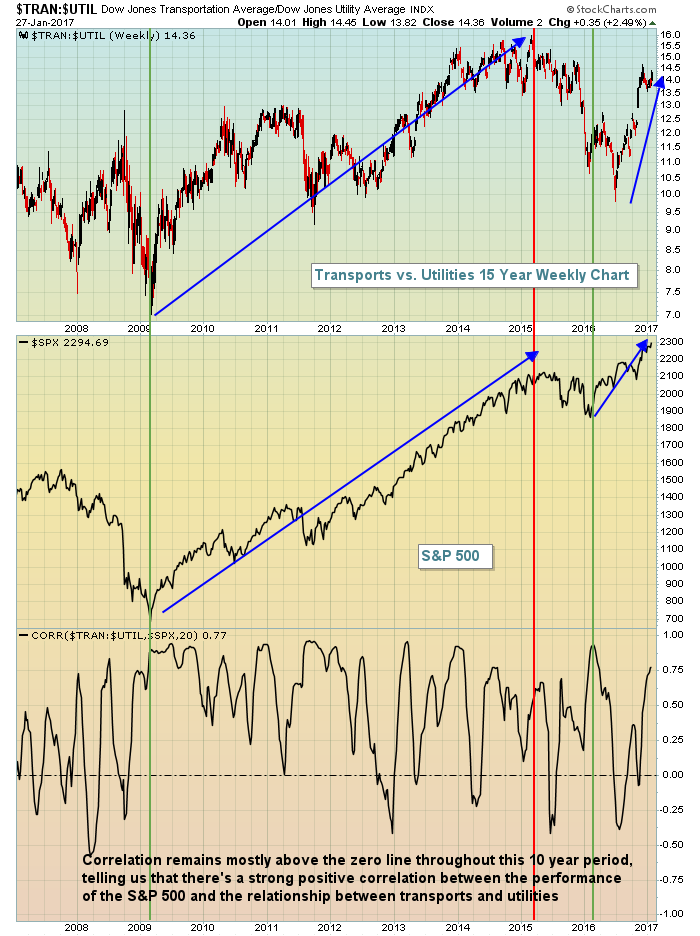 No signal is a perfect signal, but it's clear to me that when the S&P 500 is rising, I want to see the TRAN:UTIL ratio rising as well. That's been the case during the latest bull market phase and as interest rates rise, I expect to see this relative ratio continue to push higher - and that's bullish for equities.
Sector/Industry Watch
The Dow Jones U.S. Home Construction Index ($DJUSHB) was a great performer last week, despite a rising 10 year treasury yield ($TNX). I have previously written about the peculiarity of this index rising historically during winter months (November through January are this industry group's best three consecutive calendar months). February is NOT a great month, however, and the DJUSHB has just hit a key price resistance level. I'd consider ringing the register in this space until price resistance is cleared. Here's the visual:
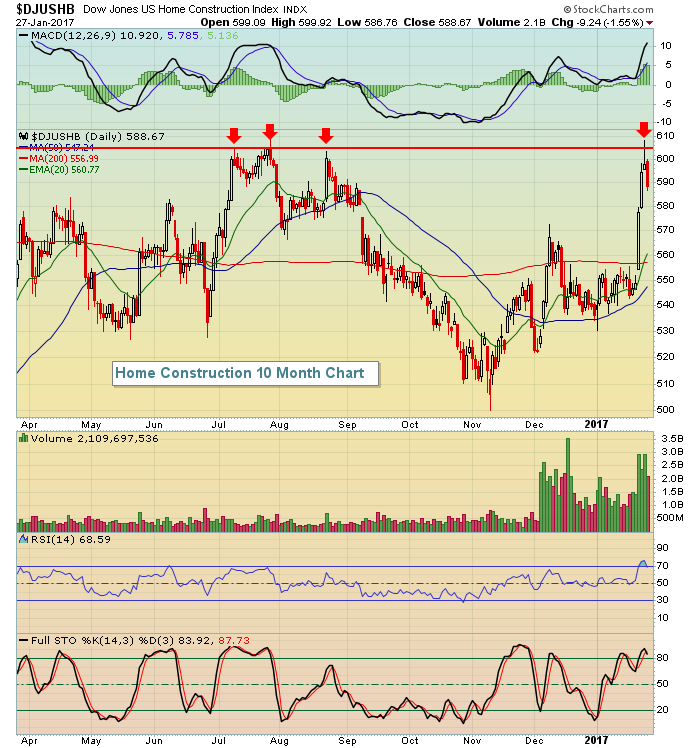 The DJUSHB backed off price resistance after threatening a breakout on Thursday. Friday's action was very poor, but the group was extremely overbought after rising 10% in just the past few trading sessions and needed a breather.
Monday Setups
CSRA made a parabolic move higher in early November and has been consolidating ever since. It's moved close to a key short-term price support level as you can see below:
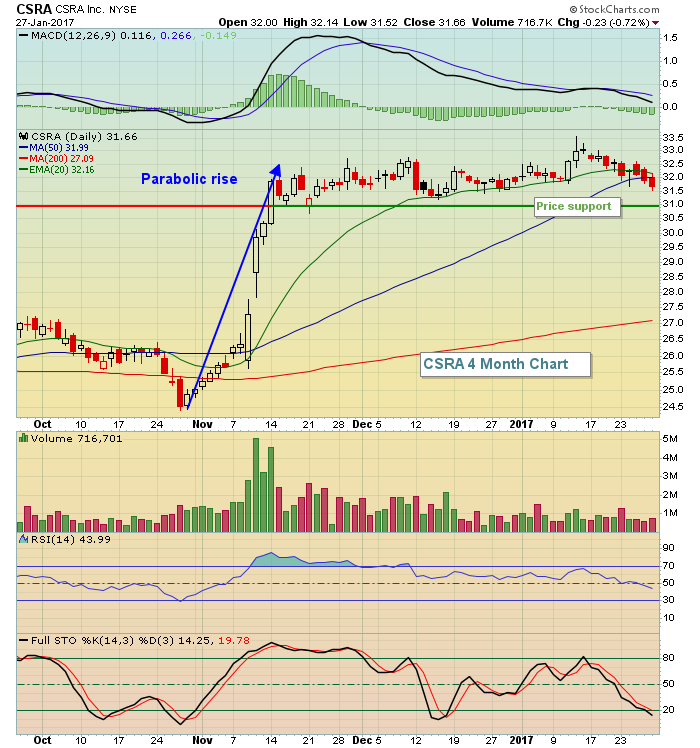 CSRA was very overbought, but its recent consolidation has resulted in its RSI declining back to 44. I look for the 31.00 level to hold on a closing basis so that's where I'd consider placing a closing stop.
Historical Tendencies
Energy (XLE) is about to enter its most bullish period of the year as history is on its side over the next three months. Check this out:
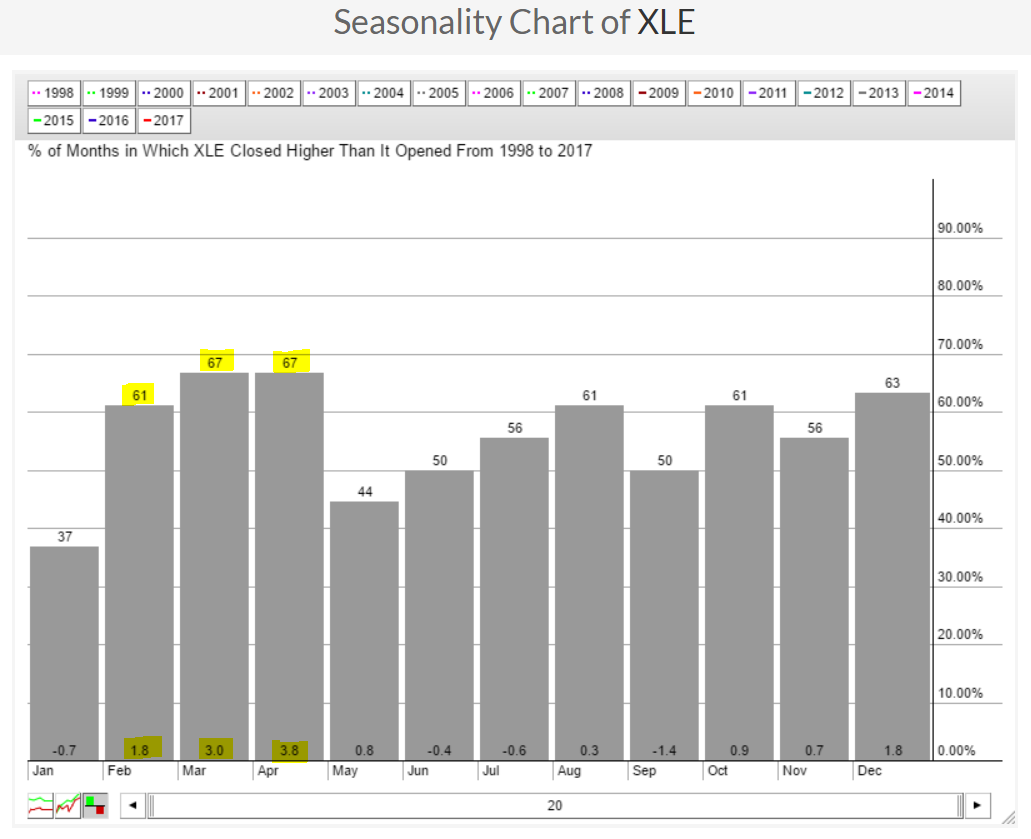 Keep in mind this is a historical chart on the performance of the XLE, not its relative performance vs. the S&P 500. For that relative strength in energy, go back to the top of this article and click on the link provided. This historical strength guarantees us absolutely nothing, but its an indication of potential strength lying directly ahead.
Key Earnings Reports
(actual vs. estimate):
AMG: 3.80 vs 3.70
BAH: .38 vs .40
EPD: .31 vs .32
(reports after close, estimate provided):
GGP: .43
IEX: .93
PFG: 1.15
PKG: 1.16
RGA: 2.50
UDR: .45
Key Economic Reports
December personal income released at 8:30am EST: +0.3% (actual) vs. +0.4% (estimate)
December personal spending released at 8:30am EST: +0.5% (actual) vs. +0.5% (estimate)
December pending home sales to be released at 10:00am EST: +0.6% (estimate)
Happy trading!
Tom
