Market Recap for Tuesday, October 4, 2016
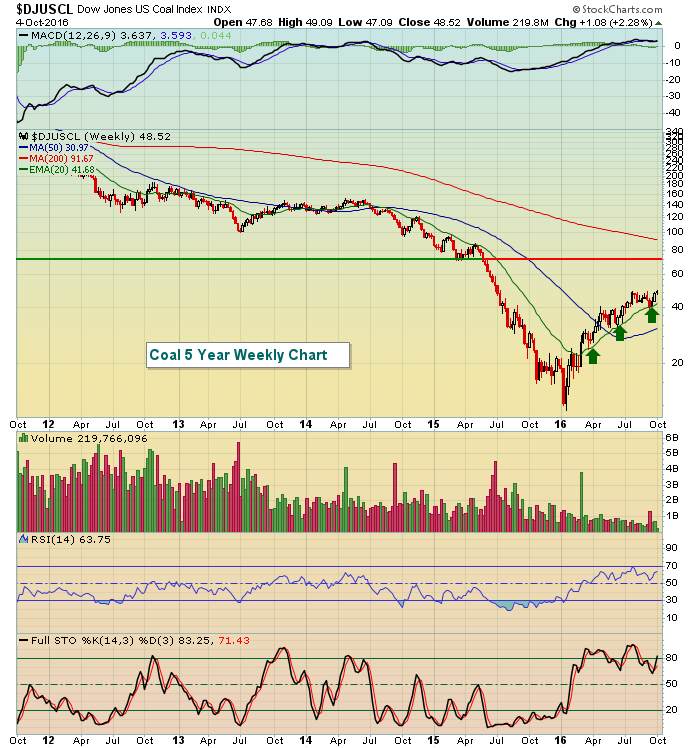
Over the past week, energy (XLE, +4.41%) and utilities (XLU, -5.70%) have been at opposite ends of the stock market spectrum, while all of the other sectors have been fairly close to the flat line. Pacing energy has been the Dow Jones U.S. Coal Index ($DJUSCL). That group was really beaten up throughout much of the current bull market, but the uptrend currently is undeniable as the rising 20 week EMA continues to prove to be excellent support during bouts of profit taking. Coal is up by more than 6% in the last week alone. Check this out:
 There doesn't seem to be a lot of overhead resistance on the DJUSCL until it approaches 70. However, as this advance continues, not the volume dropping. Fewer and fewer market participants are trading this rally, which makes it much more suspect in my opinion. For now, though, the uptrend lives on.
Financials (XLF, +0.42%) were the only sector to finish in positive territory on Tuesday as selling in the market kept the bulls at bay. Banks ($DJUSBK) and life insurance ($DJUSIL) are benefiting from the resumption in rising treasury yields. This market behavior suggests the Fed will eventually raise rates again, it's just a matter of when.
Pre-Market Action
The kick off of earnings season is widely viewed as the day that Alcoa (AA) reports, but there are a few big companies that typically report before AA. Today is a perfect example. Monsanto (MON) is a $44 billion market cap company in the basic materials sector and they reported this morning. Constellation Brands (STZ) is a $33 billion market cap company in consumer staples, while Yum! Brands (YUM) is a $35 billion market cap company in consumer discretionary and both of these consumer companies report earnings today. So it's time to begin focusing on results for the 3rd quarter and outlooks for the 4th quarter and for 2017.
Fractional global gains and losses dominated the overnight action and the action thus far this morning. The ADP employment report came in below expectations all eyes now turn to the government's nonfarm payroll report on Friday morning. That will likely impact the timing of the next Fed rate hike so traders will be interested to see if jobs momentum is gaining strength.
U.S. futures are higher this morning as the Dow Jones futures show a gain of 42 points at last check.
Current Outlook
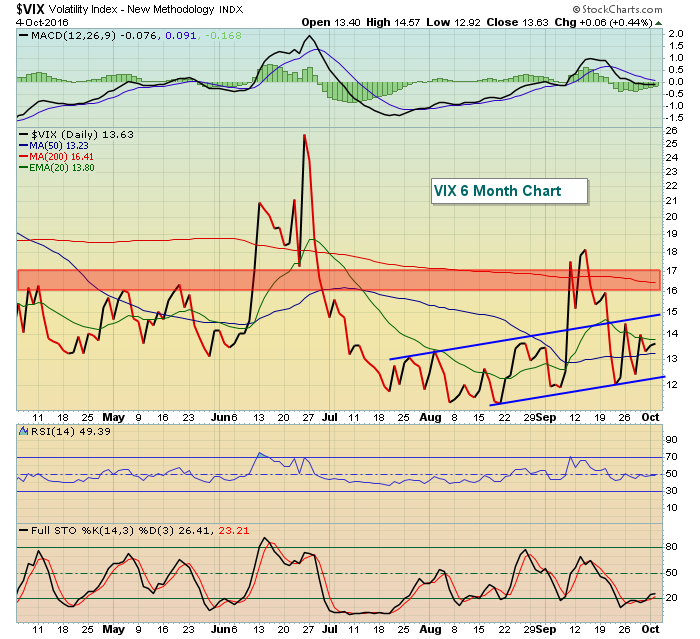
The benchmark S&P 500 has been consolidating for much of the summer, and has moved less than 0.5% in the past week. As I mentioned earlier, this past week has seen nothing more than rotation from utilities to energy. On the surface, there's been little to be overly bullish or bearish about. We're simply consolidating as money changes hands within sectors. There is one potentially slight problem, however, that could become a bigger problem so we'll need to watch it. Check out the recent uptrend in the VIX:
 The July 17-September 27 period is the worst of the year and you'll notice that the uptrend began at the start of this period. Perhaps the market was acknowledging the fact that the market tends to struggle that time of the year. But we should see the VIX subside and break this trend to the downside as the more bullish 4th quarter unfolds.
During the past two bear markets, the VIX rose above 16-17 and never broke back below that level. That's why I've shaded in that range on the chart above. A break above 17 should be respected as the possible start of a bear market.
Sector/Industry Watch
Do you like looking for stocks within beaten down sectors that could be poised to rally? Consider this industry group:
The Dow Jones U.S. Furnishings Index ($DJUSFH)
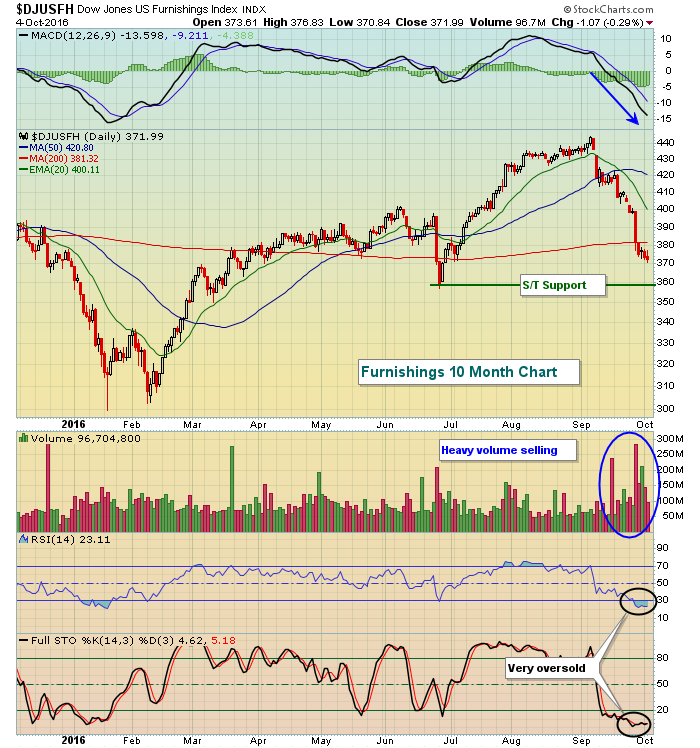
The DJUSFH has fallen almost 15% in the last month alone. But the longer-term weekly chart is bullish and the recent selling has sent price down to approach short-term price support. Take a look:
 Let me be clear about a couple things here. First, the recent breakdown and selling has occurred on very heavy confirming volume. Therefore, if price support near 360 is lost, I wouldn't hold stocks in this space. But the DJUSFH is very oversold so I'd be looking for a short-term bounce off price support. This is a trade, not an investment.
Historical Tendencies
I discussed yesterday how the Russell 2000, for whatever reason, tends to struggle during the first several calendar days in October. The S&P 500 performs much more traditionally from a historical perspective with strength from the 1st to 6th, then profit taking from the 7th to 10th. The process repeats with bullish behavior from the 11th through the 18th while more weakness follows from the 19th to 27th. Finally, the month ends with a rush of buyers. Check out the annualized returns on the S&P 500 for these distinct periods since 1950:
1st to 6th: +38.78%
7th to 10th: -20.20%
11th to 18th: +18.44%
19th to 27th: -27.08%
28th to 31st: +73.94%
Key Earnings Reports
(actual vs. estimate):
AYI: 2.09 vs 2.27
GPN: .86 vs .79
MON: .07 vs (.02)
RPM: .83 vs .81
STZ: 1.77 vs 1.66
(reports after close, estimate provided):
YUM: 1.09
Key Economic Reports
September ADP employment report released at 8:15am EST: 154,000 (actual) vs. 170,000 (estimate)
August factory orders to be released at 10:00am EST: -0.2% (estimate)
September non-ISM manufacturing index to be released at 10:00am EST: 52.9 (estimate)
Happy trading!
Tom
