Market Recap for Wednesday, October 20, 2016
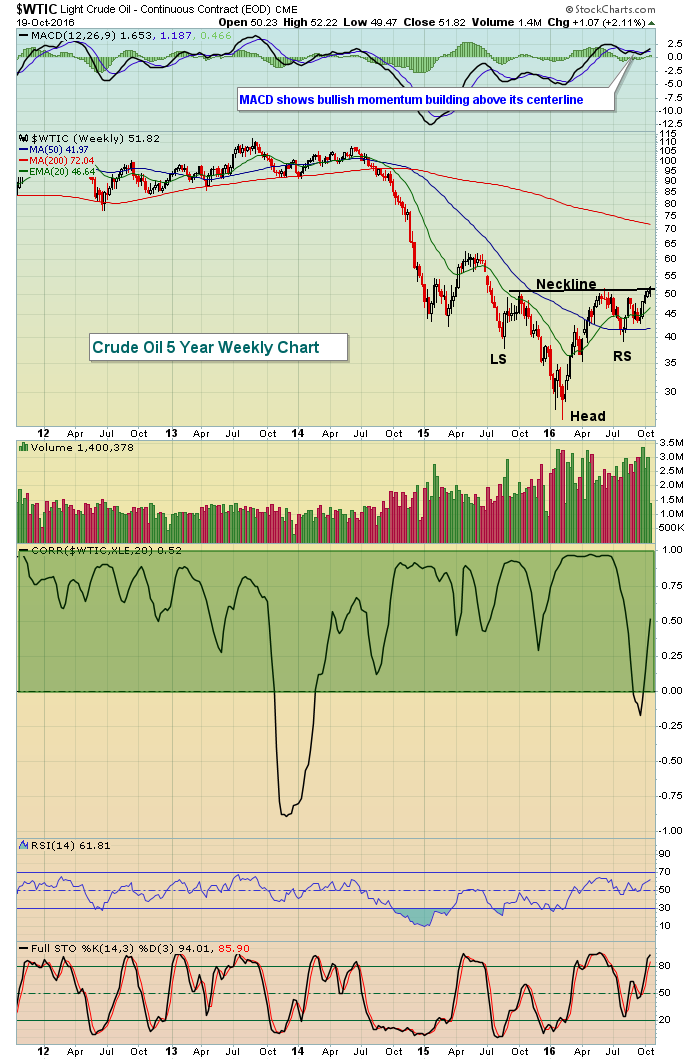
Energy (XLE, +1.42%) was clearly in charge throughout Wednesday's session as crude oil prices ($WTIC) neared a major breakout at $52 per barrel. This would represent a breakout of a bottoming head & shoulders formation that projects a future price of $75-$80 per barrel. Energy stocks follow the price of crude oil closely so such a breakout would almost guarantee the relative strength of the XLE into the foreseeable future. Check out the positive correlation between the XLE and WTIC:
 The bullish reverse head & shoulders pattern is quite symmetrical and easy to visualize by most technicians. Therefore, I believe its impact could potentially be very strong. But the real key here is the green shaded area that shows very strong positive correlation between the price of crude oil and the direction of the XLE. If this bottoming pattern confirms on the WTIC, I would expect to see solid outperformance by the XLE (vs. the S&P 500) for the balance of 2016 and possibly well into 2017.
Financials (XLF, +0.87%) also had a very strong day as bank ($DJUSBK) earnings continue to beat by wide margins. Fifth Third Bank (FITB) reported EPS this morning that more than doubled earnings expectations so the bank strength is widespread and helps to explain the sudden relative strength of banks the past few months. Prospects of higher treasury yields are also providing momentum for interest-sensitive financial groups.
Pre-Market Action
Quarterly earnings reports are beginning to pour in and most are showing EPS slightly to well above consensus estimates. That could certainly be viewed as a catalyst to higher stock prices, particularly in banking where we've consistently seen results well above estimate. Major earnings reports will continue as Microsoft (MSFT) reports after the bell today.
U.S. futures are slightly lower after the ECB left rates unchanged. Slight losses prevail in Europe as well after solid performance was felt in Tokyo as the Nikkei ($NIKK) rose 1.39% to break out to a four month, post-Brexit high.
Current Outlook
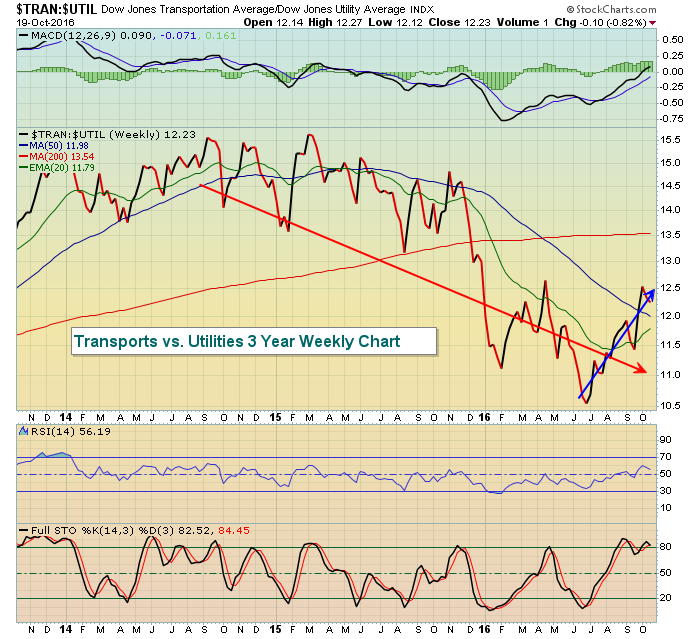
I hate to sound boring, but nothing has really changed over the past few months. We broke out on the S&P 500 in July above 2120 and reached 2190. Since that time, we've simply consolidated in that range as we await either a breakout or a breakdown. I do constantly watch the relative performance of certain aggressive areas of the market. Those short-term signals are quite bullish while the longer-term outlook remains questionable. Check out transports ($TRAN) vs. utilities ($UTIL) for instance:
 Post-Brexit, this ratio has moved up strongly, indicating that money is rapidly moving from the defensive utilities to the much more aggressive transportation group. That's what the blue line above is showing. But the longer-term ratio is down significantly from its high. So in order to feel good about the current bull market advancing further, I want to see this ratio continue to push higher.
Sector/Industry Watch
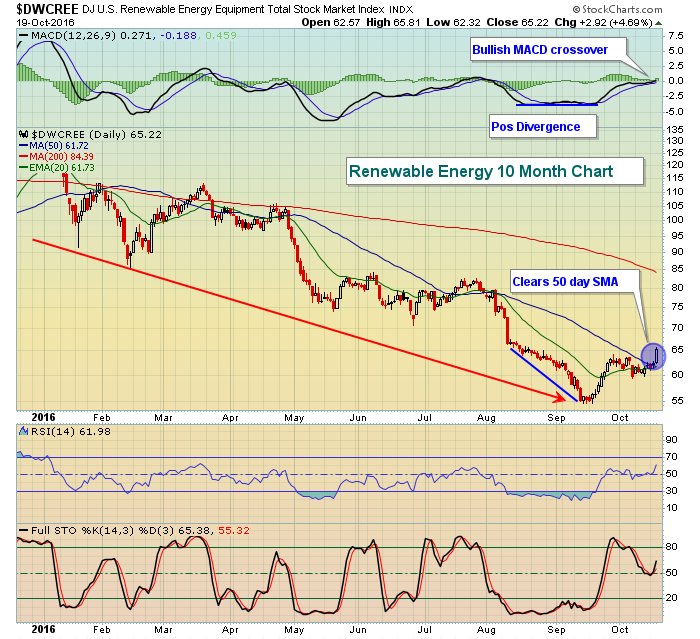
Renewable energy ($DWCREE) posted gains of 4.69% on Wednesday, closing above its 50 day SMA for the one of the few times in 2016. The prospects technically, however, have improved with the next key price resistance level another 10% higher. In other words, Wednesday's strength has room to the upside. Check out the chart:
 Renewable energy has been a laggard throughout 2016, but it did just recently print a positive divergence and now it's cleared its 50 day SMA with a bullish MACD crossover. The June low near 72-73 marks price resistance and I think the DWCREE has a reasonable chance of reaching that price level in the near-term.
Historical Tendencies
October is the final month of relative weakness on the Russell 2000. November begins a very strong stretch with November (+13.08%) and December (+38.49%) averaging solid gains since 1987. December is by far the best calendar month of the year for small caps.
Key Earnings Reports
(actual vs. estimate):
AAL: 2.80 vs 1.66
ADS: 4.54 vs 4.17
BK: .90 vs .81
DGX: 1.37 vs 1.35
DHR: .87 vs .82
FITB: .65 vs .41
ITW: 1.48 vs 1.49
PPG: 1.56 vs 1.56
RCI: .60 vs .67
TRV: 2.40 vs 2.37
TXT: .61 vs .66
VZ: 1.01 vs .99
WBA: 1.07 vs .99
(reports after close, estimate provided):
AMD: (.01)
CCI: 1.13
KLAC: 1.06
MSFT: .68
PYPL: .27
SLB: .22
WYNN: .78
Key Economic Reports
Initial jobless claims released at 8:30am EST: 260,000 (actual) vs. 250,000 (estimate)
October Philadelphia Fed released at 8:30am EST: +9.7 (actual) vs. +7.0 (estimate)
September existing home sales to be released at 10:00am EST: 5,350,000 (estimate)
September leading indicators to be released at 10:00am EST: +0.2% (estimate)
Happy trading!
Tom
