Special Webinar Scheduling Note
Because of the holiday-shortened trading week, please be sure to check out the webinar calendar on the home page. Monday's Bowley Briefing and Trading Places LIVE were cancelled due to the Labor Day holiday here in the U.S., but webinars are a "go" for today. Hope to see you there!
Market Recap for Friday, September 2, 2016
The nonfarm payrolls were released on Friday and many might argue it was the best report possible. There was job growth, but not as much as expected. So some traders would argue that the miss of consensus estimates will hold the Federal Reserve at bay past the September meeting and the continuing accommodative stance will provide the tailwinds necessary to carry U.S. equities to more all-time highs in the near-term. All of our major indices finished higher on Friday, led by utilities (XLU, +1.33%), energy (XLE, +1.13%) and materials (XLB, +1.00%). The 10 year treasury yield ($TNX) held its ground despite the disappointing jobs data so the XLU advance likely had more to do with a simple technical bounce off price and gap support. Check it out:
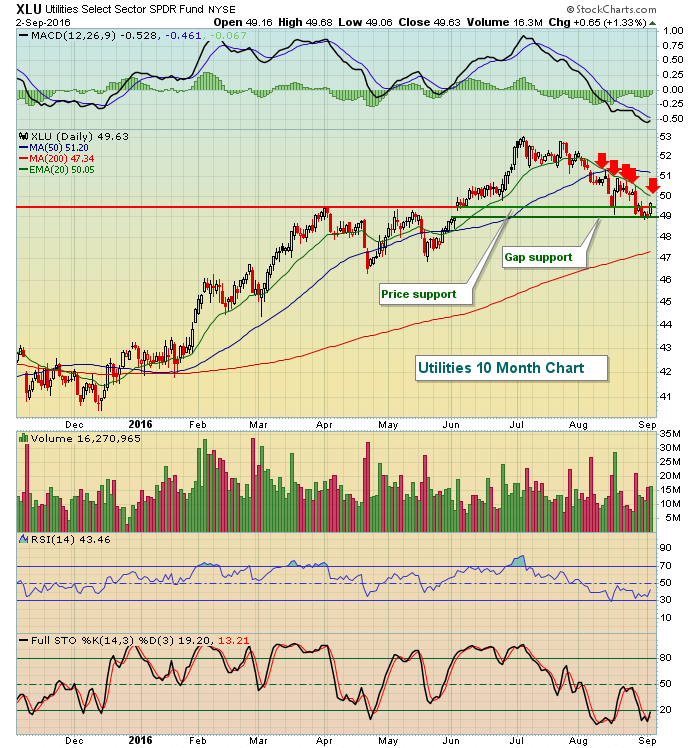 The initial issue and perhaps the bigger issue is the declining 20 day EMA that has been providing stout resistance for the past month. The red arrows highlight the difficult that the bulls have had in pushing the XLU higher. While price and gap support have held for the moment, if the bulls truly want to regain the upper hand here, they'll need to clear the 20 day EMA, currently at 50.05.
All nine sectors finished higher on Friday, but recreational services ($DJUSRQ) held back the consumer discretionary (XLY, +0.20%) space as the DJUSRQ fell nearly 3%. This is noteworthy because the DJUSRQ is typically one of the best performing industry groups during the month of September. We'll see whether historical tailwinds persevere by month's end.
Pre-Market Action
U.S. futures are slightly higher this morning, looking to extend the recent advance. Global markets are also mostly higher so if the U.S. looks to other markets for direction, it'll find buyers.
The 10 year treasury yield ($TNX) ended Friday with little volatility and a close just below 1.60%, holding onto its one month uptrend line in the process. This morning, the TNX is flat again as we await a directional clue from the treasury market.
Current Outlook
I'm watching for leadership from the NASDAQ. On its intraday 30 minute chart, it's easy to see the NASDAQ testing (and holding) key gap and price support near 5190. It also broke a recent short-term downtrend and now is looking to challenge its one month high just above 5270. Take a look:
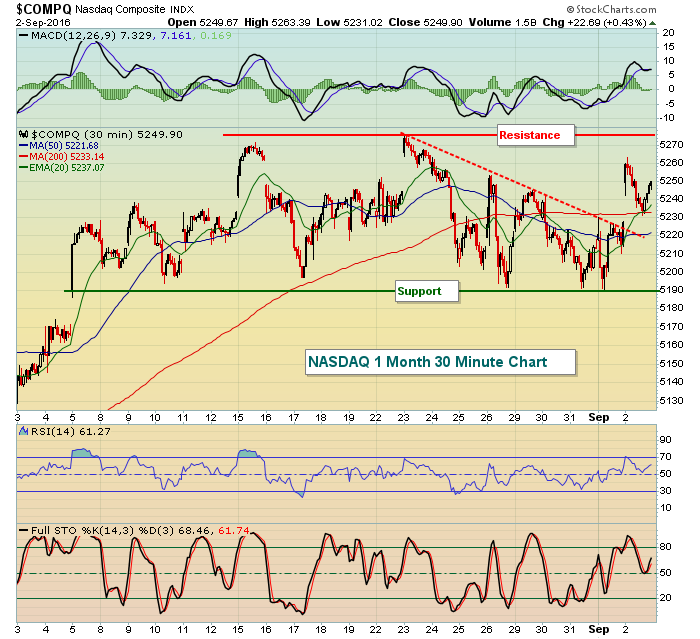 Month long consolidation continues, but the bulls did at least turn the tables on the bears in the very near-term. Clearing that 5275 area would suggest another push higher as the sideways consolidation took place after an uptrend. Resuming that uptrend is the most likely scenario from here.
Sector/Industry Watch
The U.S. dollar index ($USD) fell on Friday, but held its rising 20 day EMA. The weakness did, however, provide a spark to both energy and materials on Friday so loss of its 20 day EMA would likely send these two sectors higher so look for that. Here's the chart:
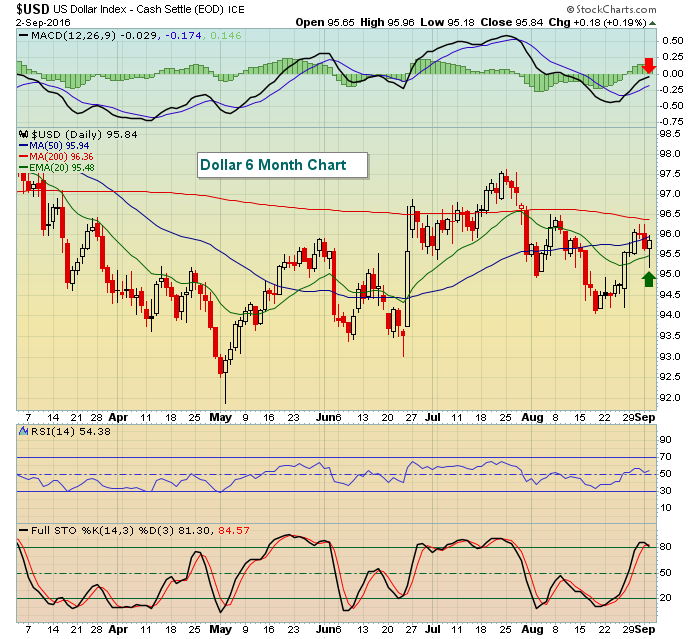 It appeared as though the USD was breaking down on Friday, only to recover by day's end. Let's see how the greenback starts a fresh week, knowing that another breakdown will likely provide a further lift to energy and materials, the two best performing sectors over the past six months.
Monday Setups
Ok, so Monday was a holiday. Then call it Tuesday setups. Usually, I provide one setup here in my blog and provide 2-3 more during my Trading Places LIVE webinar. But since I won't be hosting that webinar until tomorrow, I'll provide two setups here today.
Here's the first:
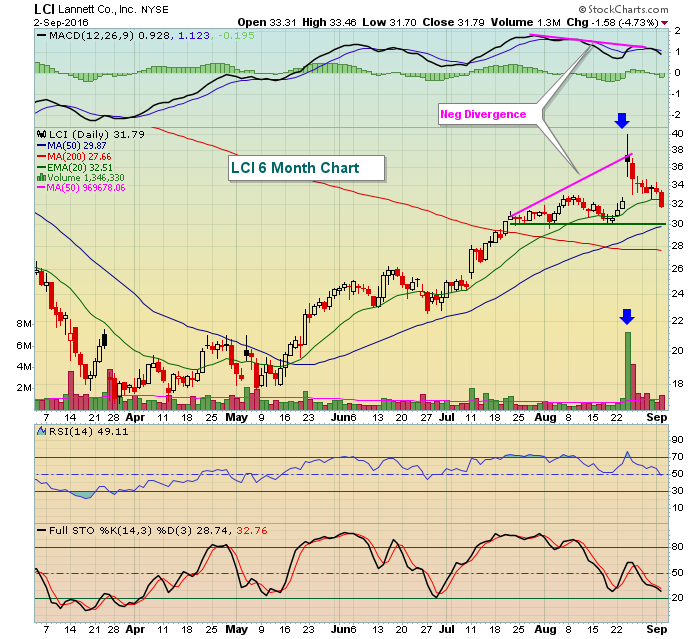 The negative divergence printed on the early August high, but it wasn't until solid earnings were released and the topping candle hit a little more than a week ago that LCI finally ran out of gas. The current selling is likely setting up a worthwhile reward to risk entry as price support and the 50 day SMA approaches.
Next:
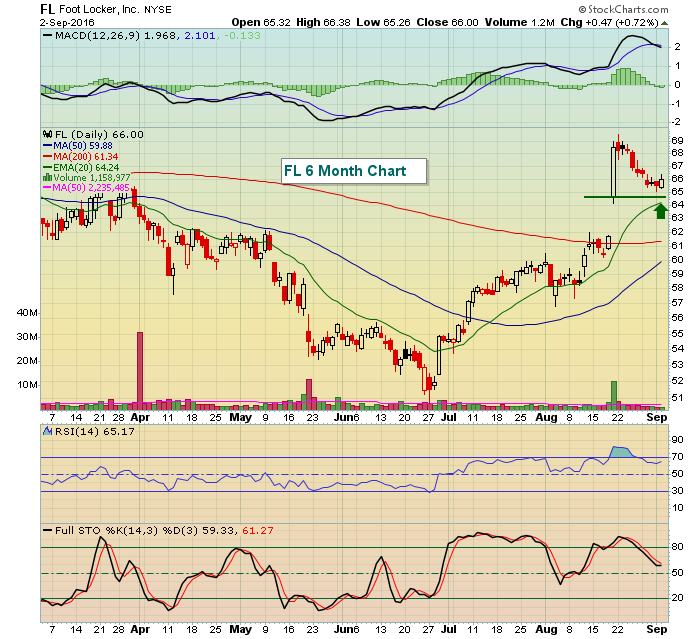 After solid quarterly results were released, FL surged higher on big volume and continued rising that day. Recent profit taking could be setting up a solid entry at the top of gap support and the rising 20 day EMA (green arrow).
If you like these setups, please be sure to subscribe at the bottom of this article. Simply click on the subscribe button and enter your email address and my articles will be mailed directly to you as soon as they're published! Thanks!
Historical Tendencies
We know that September is not a good month for U.S. equities. In fact, we know that since 1950, it's been the worst calendar month. However, there are really two tales to September - the first half of the month (+4.65% annualized return) and the second half of the month (-16.46% annualized return). So historically speaking, the worst is yet to come.
Key Earnings Reports
None
Key Economic Reports
August PMI services index to be released at 9:45am EST: 51.2 (estimate)
August ISM non-manufacturing index to be released at 10:00am EST: 55.0 (estimate)
Happy trading!
Tom
