Market Recap for Monday, August 22, 2016
Monday was another boring day with most of the action slanting to the negative side, but it was nothing terrible. In fact, both the NASDAQ and Russell 2000 managed to finish the session with small gains while the Dow Jones and S&P 500 suffered just minor losses. Defensive sectors led the action with utilities (XLU, +0.26%), healthcare (XLV, +0.20%) and consumer staples (XLP, +0.15%) in the top three spots on the sector leaderboard. Energy (XLE, -1.15%) took the brunt of the selling and that held back the Dow Jones and S&P 500.
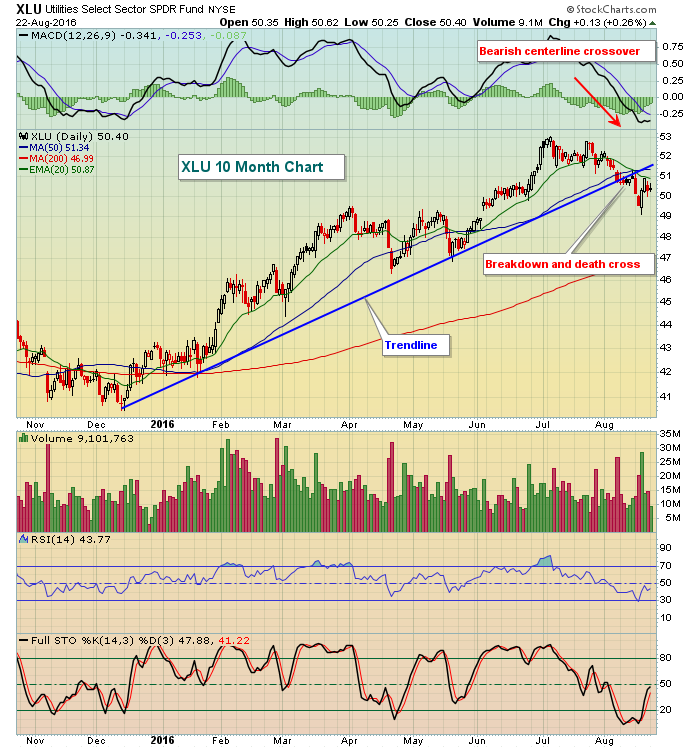
Utilities have been suggesting that treasury yields could be headed higher as the XLU has traded in bearish fashion lately. Check out its daily chart:
 The last time we saw the XLU print a "death cross" (20 day EMA moving below 50 day SMA) was at the end of May and it didn't last with prices quickly rising again. This time, however, the MACD has weakened considerably, the trendline has been broken and we've already seen multiple failed attempts to clear the declining 20 day EMA without success. I'd need to see the 20 day EMA cleared before considering this group for a long trade.
Pre-Market Action
U.S. futures are pointing to a slightly higher open, with the Dow Jones futures up 46 at last check. Crude oil ($WTIC) is down approximately 1% as profit taking continues after the recent surge higher.
The German DAX is rebounding right on cue as that European index is up close to 1%. Other key European indices are higher as well, while there was bifurcated action in Asia overnight.
The treasury market also appears to be perplexed, not really sure which way to trend. With the exception of a couple trading sessions, the 10 year treasury yield ($TNX) has been bound between 1.50% and 1.60% the past six weeks. This morning, it's nearly unchanged at 1.55%, right in the middle of the recent range.
Current Outlook
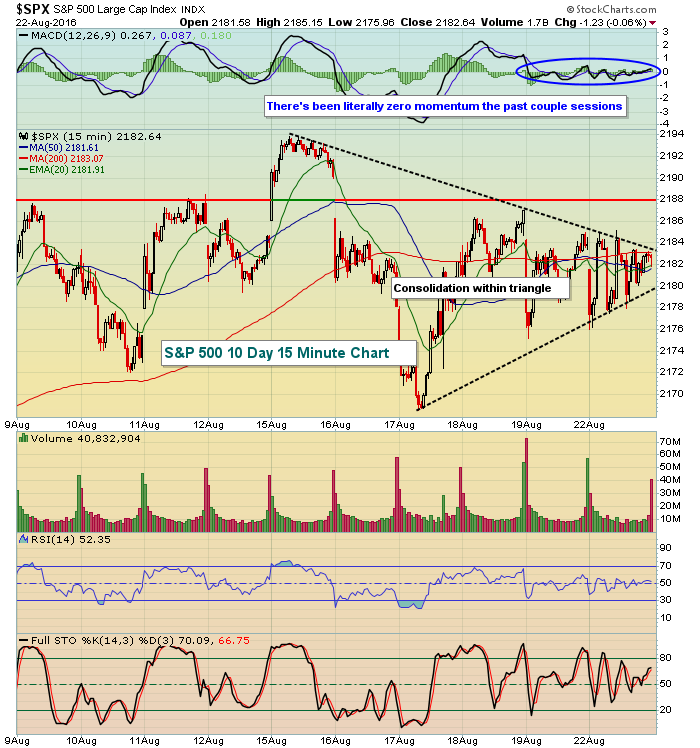
The S&P 500 has done little the past ten days, but is currently squeezing in a triangle. Perhaps a breakout would help determine the next directional move in the near-term. It's been very difficult to sustain a trend in either direction as the following chart clearly illustrates:
 The strength in futures suggests we could see the triangle break to the upside at the opening bell. If so, the next key level of resistance would likely be felt closer to 2188. Following that would be the all-time high at 2194. 2169-2175 remains the short-term support zone to watch. For now, we simply continue to consolidate.
Sector/Industry Watch
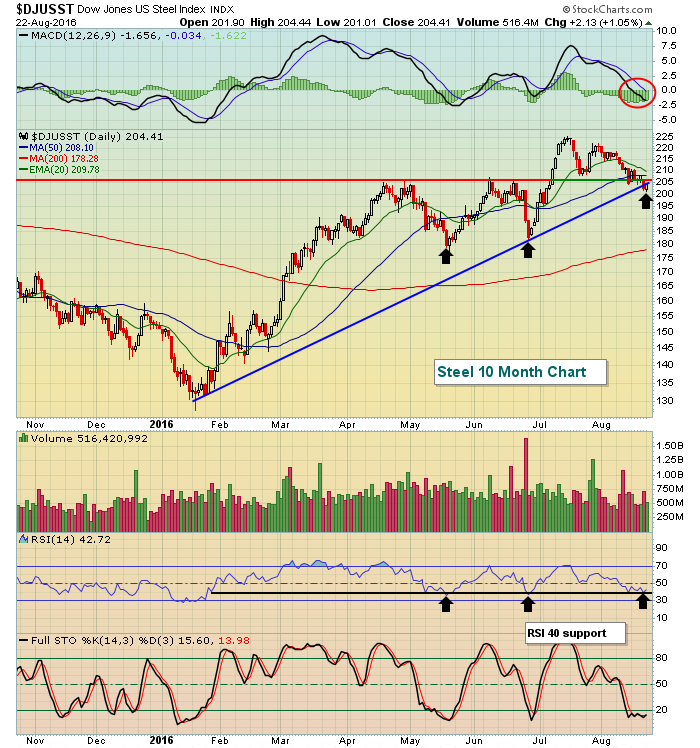
The Dow Jones U.S. Steel Index ($DJUSST) was the 3rd best performing industry group on Monday, trailing only biotechs ($DJUSBT) and real estate services ($DJUSES). The strength in steel could be meaningful, however, as it turned at a key area of price and trendline support. Take a look:
 RSI is now at 42 and this level of RSI is where we've seen significant turns to the upside. Given the bearish crossover in the MACD, though, I'd be very careful if steel does not move higher from this level. In fact, I'd consider the lows of the past two sessions as my stop if I traded any of the component stocks. USX-U.S. Steel Group (X) looks like the best candidate for a long trade as it reversed yesterday on its 50 day SMA and at a key price support level near 20.
Historical Tendencies
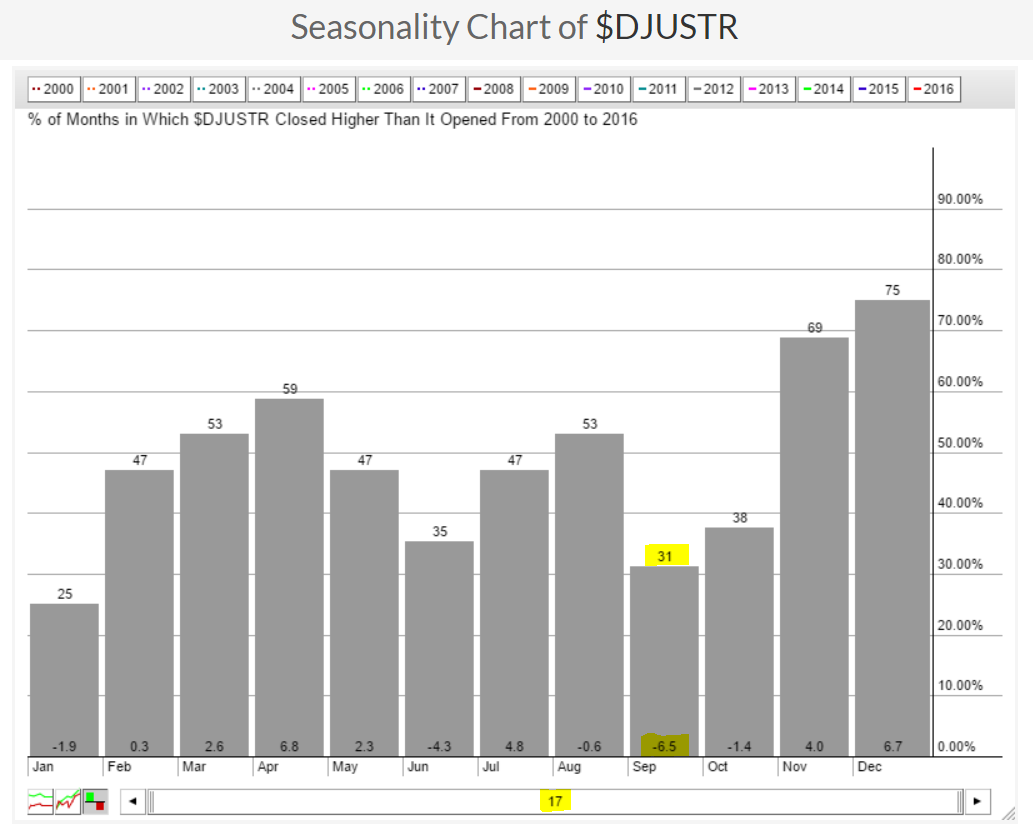
The worst performing industry group during the month of September has been the Dow Jones U.S. Tires index ($DJUSTR), which has averaged losing 6.5% per September and has risen just 31% of Septembers this century. Here's the seasonal performance:
 Notice that October isn't a great month as well. So if the recent uptrend in the DJUSTR is to continue, it will need to conquer the seasonal headwinds that it faces.
Key Earnings Reports
(actual vs. estimate):
BBY: .57 vs .42
BMO: 1.49 vs 1.38
SJM: 1.86 vs 1.75
TOL: .62 vs .63
(reports after close, estimate provided):
INTU: (.23)
LZB: .29
Key Economic Reports
August PMI manufacturing index to be released at 9:45am EST: 53.2 (estimate)
July new home sales to be released at 10:00am EST: 580,000 (estimate)
Happy trading!
Tom
