Market Recap for Wednesday, April 27, 2016
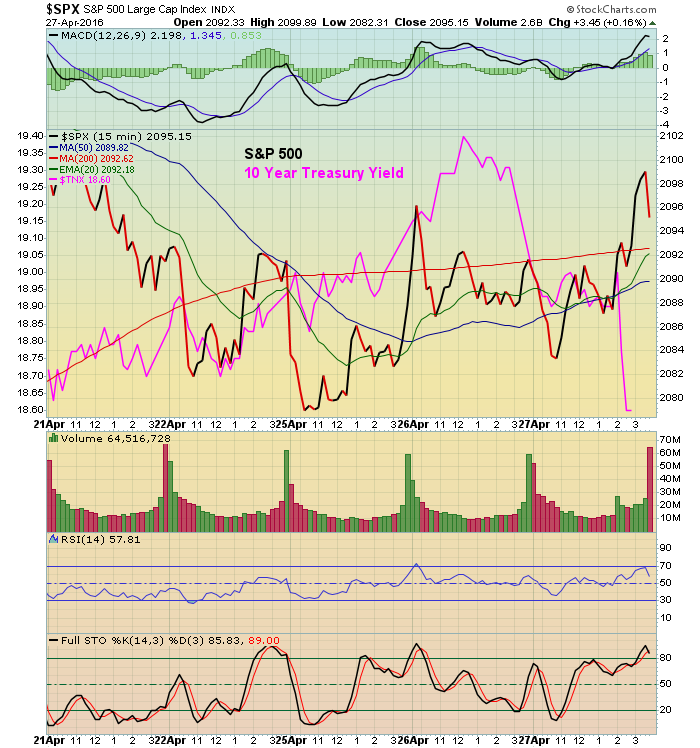
Well another FOMC meeting has come and gone. Not much has changed really. The Fed still seems adamant about raising rates, but they're not sure as to the timing. The next meeting in June is a real possibility, but they're non-committal. The reaction to the meeting was interesting. Money rotated mostly toward safety and defense. The most obvious sign of that was treasury yields. Money poured into treasuries after 2pm EST on Wednesday and the 10 year treasury yield ($TNX) fell precipitously over the next hour. Typically, the TNX and SPX move in the same direction, but check out the relationship the past five days:
 From mid-day Tuesday through Wednesday's close, the TNX fell from 1.94% to 1.86%, a rather significant drop. Bond traders see economic weakness ahead. Until and unless the TNX can rise above 2.00%, it's going to be difficult to support a rally in the S&P 500 and futures this morning are underscoring how risky it is to chase equity rallies like the one we had yesterday afternoon.
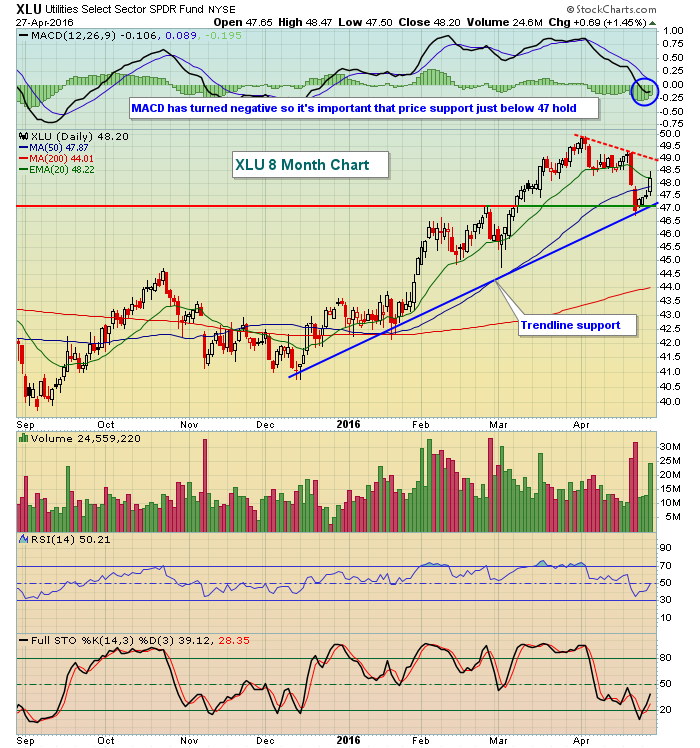
One beneficiary of the FOMC policy statement (and market reaction) was utilities (XLU). I wrote yesterday that the XLU was in a precarious situation technically after it had fallen beneath 50 day SMA support and lost its MACD centerline. Another jump in treasury yields could have spelled doom for the group, but instead the sudden drop in yields had the opposite effect - utilities soared. Take a look at the reaction in the XLU:
 Climbing back above its 50 day SMA and holding trendline support is a positive start but the XLU isn't out of the woods. Its MACD is in negative territory, suggesting that momentum has turned in favor of the bears. Price support just beneath 47.00 needs to hold.
Energy (XLE +1.90%) once again led the market higher on Wednesday. In the Sector/Industry Watch section below, you can see the role that the weakening dollar ($USD) has played in the XLE advance.
Clearly, technology (XLK) was the big loser from a sector perspective, dropping .46% on the session as Apple (AAPL) fell short of expectations.
Pre-Market Action
U.S. futures joined global markets sharply lower after the Bank of Japan surprised everyone with its decision to keep its monetary policy steady. Markets wanted more stimulus and it was apparent with the Tokyo Nikkei ($NIKK) falling 3.61%. Other key Asian markets were closer to the flat line.
In Europe, the major indices are down more than 1%. In particular, I'll be watching to see if the German DAX ($DAX) can remain above the psychological 10000 level.
Current Outlook
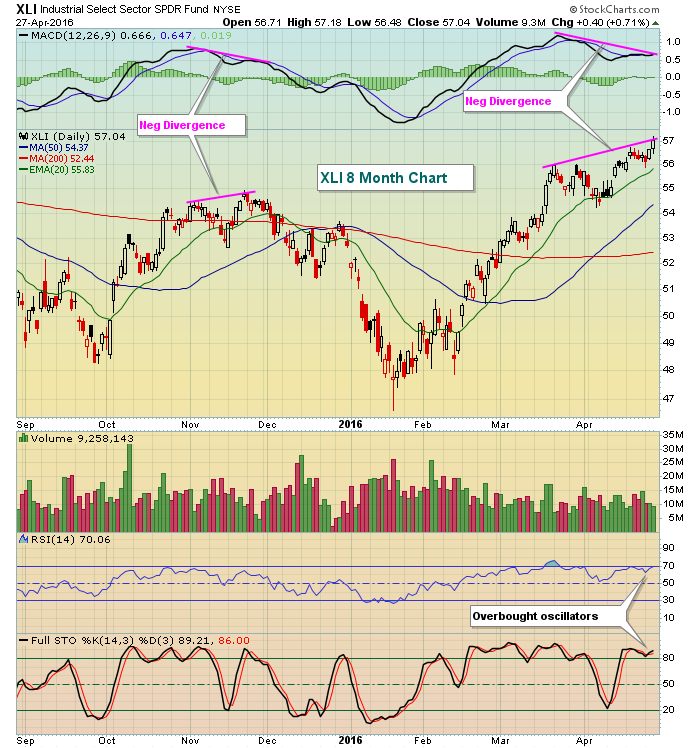
Slowing momentum is the problem. Daily negative divergences continue to print everywhere. Even strong areas of the market that continue to forge to new highs cannot escape this warning sign. Take the industrial sector (XLI) for instance. Wednesday was another very strong day for the group and it's been in a strong uptrend since bottoming in mid-January. Gains in April, though, have been accompanied by slower volume and a lower MACD and that's likely to catch up with the group sooner rather than later. Look at the chart:
 Overbought conditions, slowing momentum and light volume (less than 10 million shares changed hands on Wednesday's fresh new high) are likely to plague the bulls near-term. Owning industrial stocks at this point would be high risk, in my opinion. Given that the industrial sector is one of the four aggressive sectors - and we already know how rudely the aggressive technology group has been treated lately - it's difficult imagining the Dow Jones and S&P 500 continuing its path higher unabated.
Sector/Industry Watch
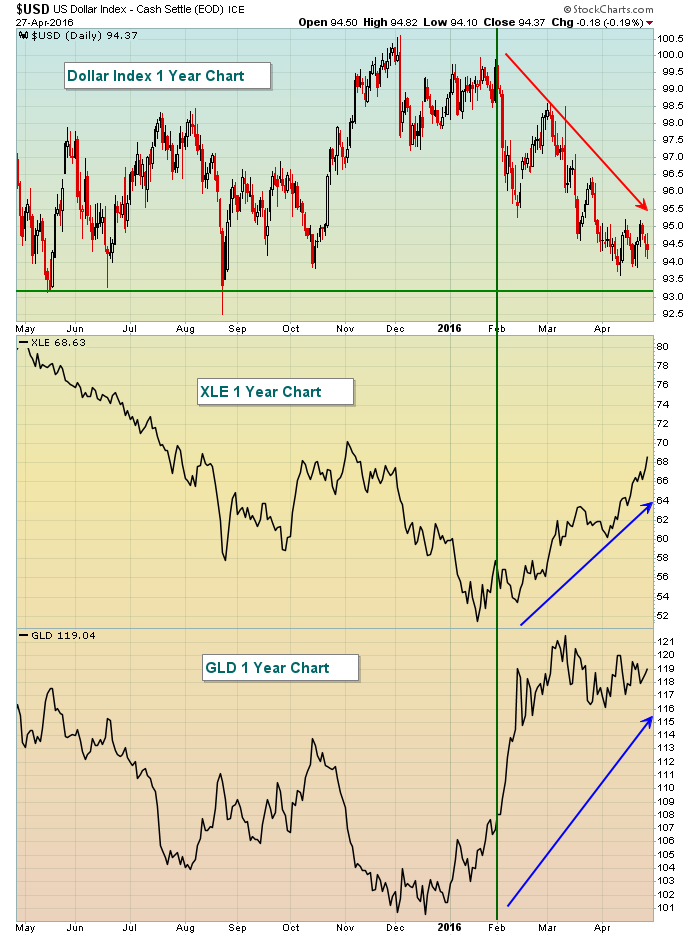
The weakening dollar index ($USD) has played a role in sending commodity prices higher. The USD, however, has hit key price support. A break below should easily keep the commodity bulls in charge, but what happens to commodities if the dollar holds support and begins to rally? Are global economies strong enough to keep the commodity rally going? Here's the dollar chart, along with energy (XLE) and gold (GLD):
 Since early February, the dollar has been declining and that's provided impetus for an energy and gold rally. But the dollar now is very near support just above 93. And while I didn't mark it on the chart, you can see that the XLE is approaching its early November reaction high just above 70. It probably makes sense to book at least a portion of XLE profits as it nears price resistance at 70.
Historical Tendencies
Beginning tomorrow, the S&P 500 embarks on a bullish historical period that lasts approximately one week. Here are the annualized returns for each day during the period:
April 29th (Friday): +46.88%
May 2nd (Monday): +48.87%
May 3rd (Tuesday): +20.52%
May 4th (Wednesday): 0.28%
May 5th (Thursday): +39.37%
Key Earnings Reports
(actual vs. estimate):
ADP: 1.17 vs 1.18
AET: 2.30 vs 2.22
ALXN: .87 vs .91
BMY: .74 vs .66
CELG: 1.18 vs 1.05
CL: .63 vs .63
COP: (.95) vs (1.07)
DOW: .89 vs .83
F: .68 vs .43
MA: .86 vs .85
MO: .72 vs .68
RTN: 1.43 vs 1.36
SIRI: .03 vs .03
TWC: 1.81 vs 1.73
UPS: 1.27 vs 1.22
WM: .58 vs .55
(reports after close, estimate provided):
AMGN: 2.56
AMZN: .61
BIDU: .78
EXPE: (.30)
GILD: 3.03
JNPR: .29
LNKD: (.28)
SYNA: 1.21
Key Economic Reports
Q1 GDP released at 8:30am EST: +0.5% (actual) vs. +0.7% (estimate)
Initial jobless claims released at 8:30am EST: 257,000 (actual) vs. 260,000 (estimate)
Happy trading!
Tom
