Market Recap for Friday, November 20, 2015
Consumer discretionary stocks (XLY) led six sectors higher on Friday. The only three that did not participate were energy (XLE), materials (XLB) and consumer staples (XLP). Crude oil ($WTIC) reversed on Friday and finished near its low of the session, just above $41 per barrel. That, combined with a very strong dollar, sent energy shares lower and the dollar strength also clearly took a toll on materials. The XLY widely outperformed the XLP as traders again displayed their growing appetite for risk, a continuing bullish theme.
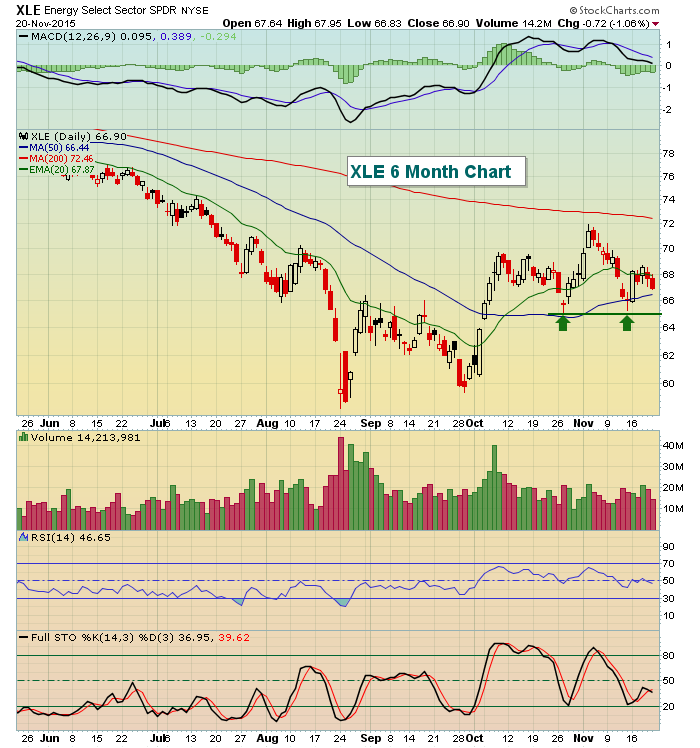
For the week, all nine sectors were higher, led by consumer discretionary's 4.5% advance. Technology also performed quite well, gaining 4.3%. Energy shares also lagged for the week as it rose just 1.4% after bouncing from the 65.00 level. As a reminder, here's the visual showing this key support:
A break below 65, especially a closing break below, would likely trigger renewed selling to follow the prior downtrend. A weak energy group was a key factor in the slowing momentum in the S&P 500 during the latter stages of 2014 and throughout 2015. Another surge higher in the S&P 500 will likely need to be accompanied by a much stronger energy space.
Pre-Market Action
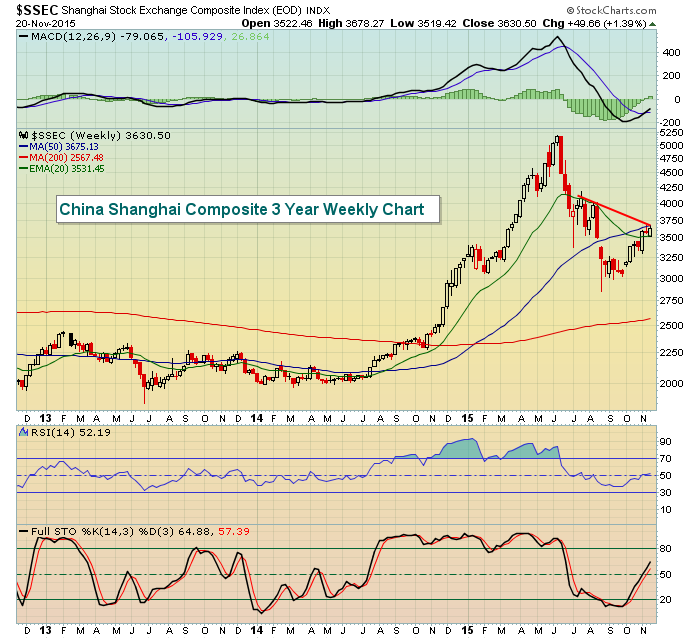
U.S. futures began the day and this holiday-shortened Thanksgiving week in negative territory, but have since reversed and were flat at last check. Action in Asia was mixed overnight while European indices are mostly lower. China's Shanghai Composite is attempting to close above its 50 week SMA (currently 3675) for the first time since the massive summer selling began. Take a look:
The red downtrend line off of recent weekly candles also suggests this level will be important. Keep in mind, however, that there's been consistent correlation between the Shanghai Composite and S&P 500 over the years so a failure here would not necessarily alter the path of the S&P 500.
Current Outlook
I remain bullish. I was short-term bearish on the price and moving average breakdowns in August. Of course, the huge spike in volatility (VIX) created a whipsaw environment for equities for several subsequent weeks. But now we're seeing a much more stable VIX, one that quickly is falling back to more normal readings associated with a bull market. The huge drop in the VIX last week countered the severe spike during the prior week. The last time we saw a spike in the VIX one week followed by a huge drop the next to completely negate the bears' advantage was late January 2015, just prior to the S&P 500 moving to fresh all-time highs in early February. The big difference this time around is that the weekly MACD is now coming up from negative territory. A crossover would suggest building momentum for the bulls. Back during February's breakout, the weekly MACD was very suspicious and that lack of momentum seemed to weigh on the index until the August selling kicked in.
For more on why I believe the S&P 500 is poised to head higher, read my ChartWatchers article from this weekend entitled, "Four Reasons The Market Is Heading Higher". Feel free to agree or disagree.
Sector/Industry Watch
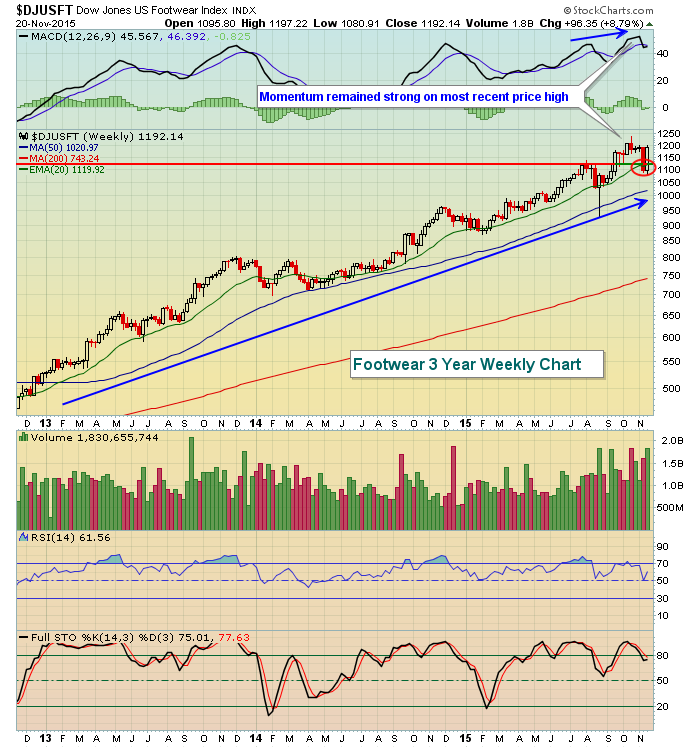
The Dow Jones U.S. Footwear index ($DJUSFT) got a big lift from Nike (NKE) on Friday as that retail giant announced a $12 billion share buyback, a 14% increase to its dividend and a 2 for 1 stock split. That sent NKE soaring and the index went along for the ride. The following chart suggests momentum remains quite strong and the red circle shows that NKE's strength came just in time - as both 20 week EMA and price support were lost temporarily. Check it out:
Historical Tendencies
Below are the annualized returns on the Russell 2000 for each of the remaining calendar days in November:
November 23 (today): +40.70%
November 24 (Tuesday): +272.03%
November 25 (Wednesday): +54.51%
November 27 (Friday): +33.69%
November 30 (next Monday): +75.76%
Key Earnings Reports
(actual vs. estimate):
GME: vs .59 (had not reported at last check)
JEC: .80 vs .76
(reports after close today, estimate provided):
BRCD: .21
Key Economic Reports
November PMI manufacturing index to be released at 9:45am EST: 54.5 (estimate)
October existing home sales to be released at 10:00am EST: 5,400,000 (estimate)
Happy trading!
Tom


