Market Recap for Thursday, November 12, 2015
Over the past 5-6 trading sessions, the selling was fairly contained and appeared to be nothing more than normal profit taking after a lengthy advance from the depths of the late September lows. That changed yesterday. I'm not writing off the potential for all-time highs prior to the end of the year, but just as it was important to respect price resistance as we neared it earlier in November, we now have additional obstacles to the upside that we must respect. All of our major indices closed beneath rising 20 day EMAs. Typical bull market behavior is to hold that moving average during short-term bouts of profit taking. The loss of this key moving average increases the odds of more consolidation and frustrating price action - especially over the next ten days or so where we generally deal with seasonal weakness.
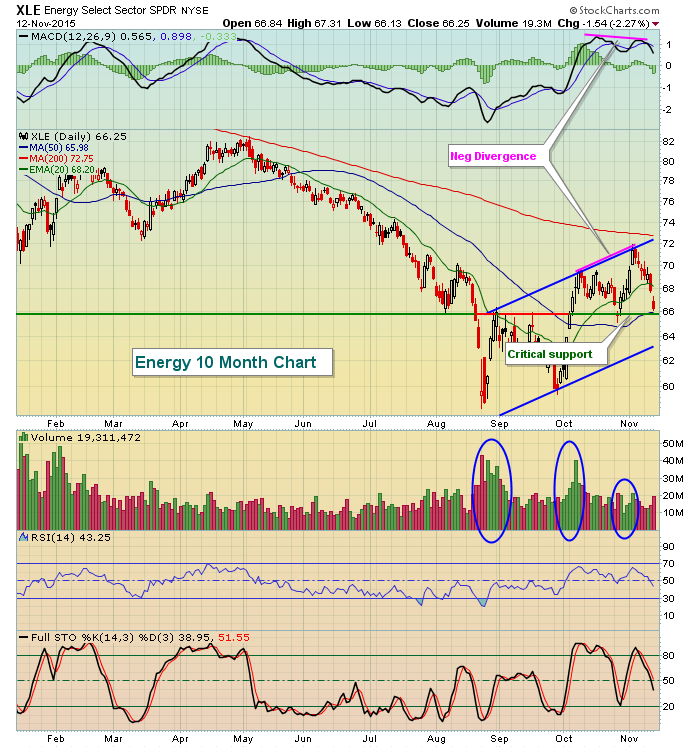
Energy led the action to the downside once again, losing another 2.27%. Materials weren't far behind, falling 2.01%. Despite a bit of weakness in the U.S. dollar, gold (GLD) managed to see intraday lows near 103, a level not seen since early 2010. The recent rise in the dollar is most definitely having an impact on the energy and materials sectors, but poor technical conditions aren't helping. I posted recently about the negative divergence on the XLE amid signs of slowing upside momentum and the XLE is performing about as expected with a 50 day SMA test on Thursday. Here's a reprint of the chart I posted on Wednesday:
For now, the uptrend remains intact in my view, but it will be important to turn the tide of selling fairly quickly. Price support and the rising 50 day SMA should serve as support. However, crude oil prices ($WTIC) have been tumbling again amid building inventory levels so a break in support of the XLE should be respected.
One positive from Thursday's action is that the two best performing sectors on the session were technology and consumer discretionary, which represent two of our four aggressive sectors. So money is not rotating in any significant fashion away from aggressive areas. Still, that positive doesn't feel too good when the market sells off like it did on Thursday.
Pre-Market Action
After Thursday's close, Cisco Systems (CSCO) and Applied Materials (AMAT) - two influential technology companies - reported their latest quarterly results. AMAT managed to beat both top and bottom line estimates and is trading higher this morning. CSCO, on the other hand, disappointed traders and is currently down more than 5% in pre-market trading. For those hoping that these two reports would stem the tide of selling, it's not happening. U.S. futures are once again lower, continuing their recent trend of downward pressure. Global markets set the stage as Asian markets were lower overnight and, at last check, key European markets are all lower as well.
After a fairly quiet economic week, retail sales were reported this morning lower than expected and both PPI and core PPI were negative so the market will need to be resilient to hang onto support levels. On the economic new, treasuries are moving higher with the 10 year treasury yield ($TNX) falling back to test support at 2.30%. It would be best for equities if the TNX held this support level and moved higher.
Current Outlook
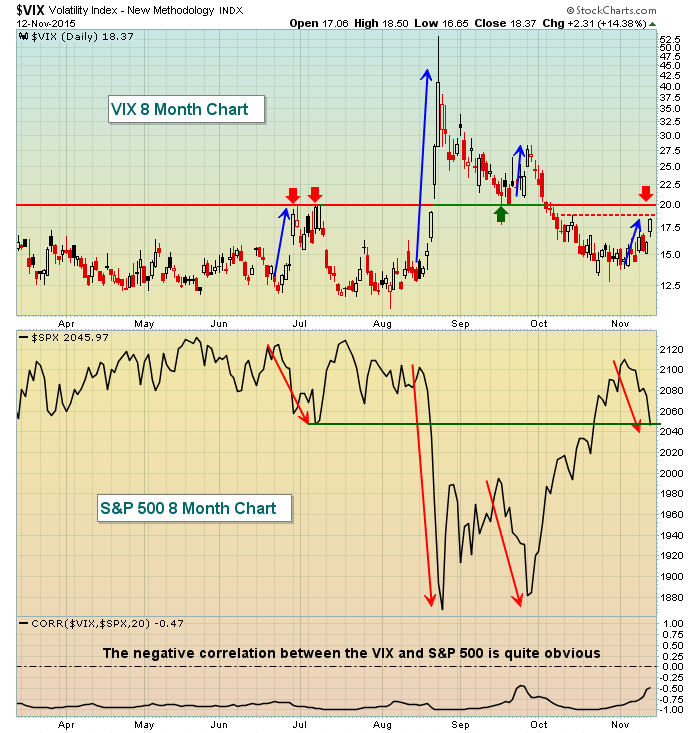
While losing 20 day EMAs was clearly a short-term negative for technical bulls, I'm most concerned with the sudden spike in the Volatility index ($VIX). I would like to see the VIX reverse in the 18-19 range, the level on November 14th when we saw the most concerted selling effort of the past month. Over the past several months, 20 has been a very pivotal area on the VIX as illustrated in the following chart:
As we approach VIX 20, keep this chart in mind. A break above and we could be looking at much steeper losses in the near-term. However, a reversal on the VIX below 20 would be a bullish development as VIX 20 resistance has marked a bottom in the S&P 500 (early July). Note that bottom was almost exactly where the S&P 500 closed yesterday. Next week is a bearish week historically so the bulls would really like to hold onto this 2040-2045 level as it did earlier in 2015, prior to the August meltdown.
Sector/Industry Watch
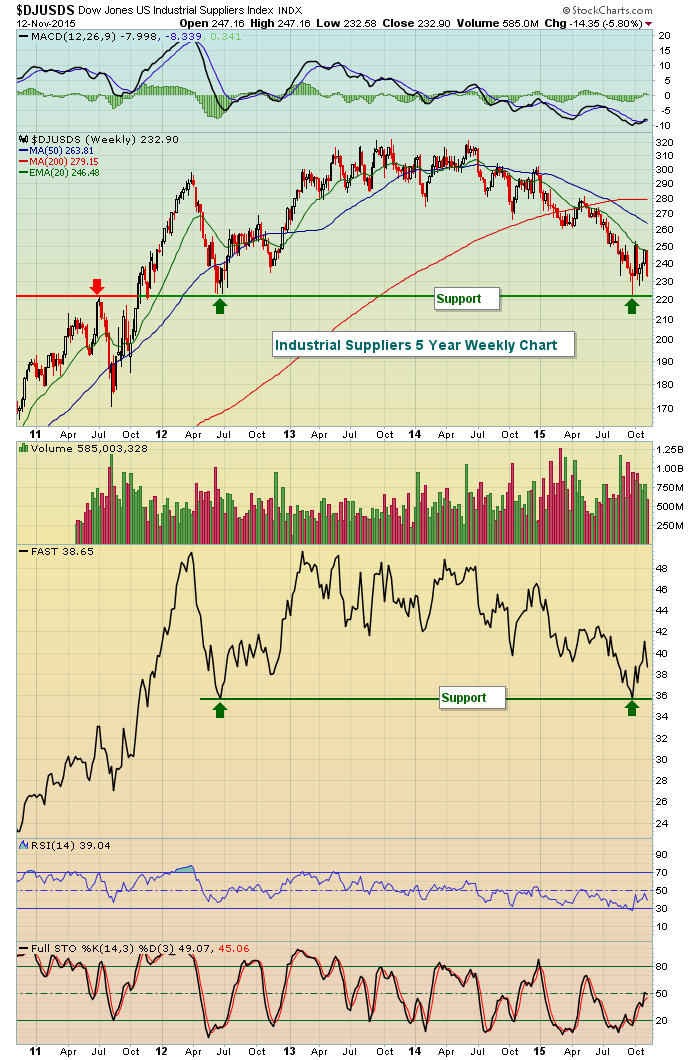
Industrial suppliers ($DJUSDS) were treated rather rudely on Thursday as they dropped a severe 3.95%. Looking at a weekly chart, the DJUSDS is nearing a long-term support level. Whether they hold it could be somewhat dependent on how Fastenal (FAST) performs as that stock also seems to be on a crash course for similar support. Check it out:
Historical Tendencies
From November 9th through November 22nd, the Russell 2000 only has two calendar days (today and November 21st) that have produced positive annualized returns since 1988. Considering that small caps failed at recent price resistance and once again have begun to lag the other indices, be very careful through next week. Here are the annualized returns on the Russell 2000 for each calendar day next week:
November 16 (Monday): -46.36%
November 17 (Tuesday): -20.76%
November 18 (Wednesday): -0.44%
November 19 (Thursday): -167.11%
November 20 (Friday): -81.57%
The good news is that Monday, November 23rd will begin an extremely bullish period for the Russell 2000. Also, keep in mind these are "tendencies". Since 1988, there have been 100 trading days that have fallen from November 16th through November 20th. 61 have been lower while 39 have been higher. So while the odds favor the bears in terms of historical performance, it's not a guarantee.
Key Earnings Reports
(actual vs estimate):
JCP: (.47) vs (.58)
TYC: .61 vs .61
Key Economic Reports
October PPI released at 8:30am EST: -0.4% (actual) vs. +0.2% (estimate)
October Core PPI released at 8:30am EST: -0.3% (actual) vs. +0.1% (estimate)
October retail sales released at 8:30am EST: +0.1% (actual) vs. +0.3% (estimate)
October retail sales ex-autos released at 8:30am EST: +0.2% (actual) vs. +0.4% (estimate)
September business inventories to be released at 10:00am EST: +0.0% (estimate)
November consumer sentiment to be released at 10:00am EST: 92.0 (estimate)
Happy trading!
Tom


