Markets often seem chaotic and random. However, with some time and patience, students of technical analysis can study swings and see the order within the chaos, as well as trading opportunities.
In the book Trade What You See, How to Profit from Pattern Recognition, written by myself and Larry Pesavento, we discuss Harmonic numbers and swings in Chapter 3. Harmonics can be thought of as vibratory swings, some small, some larger. They all are part of a process of contraction and expansion phases. There are repetitions that can help traders in entry, exit, stop loss and profit target techniques.
Recently, the markets, referring to stock indexes, have had large moves both on the downside and the upside. Most recently, they have had swings in both directions and are now somewhere in the middle-to-upper end of the February high-to-March low swing.
Chart 1 below shows a 120-minute chart of the S&P 500 Emini and the price swings since late March 2020 to the middle of May 2020.
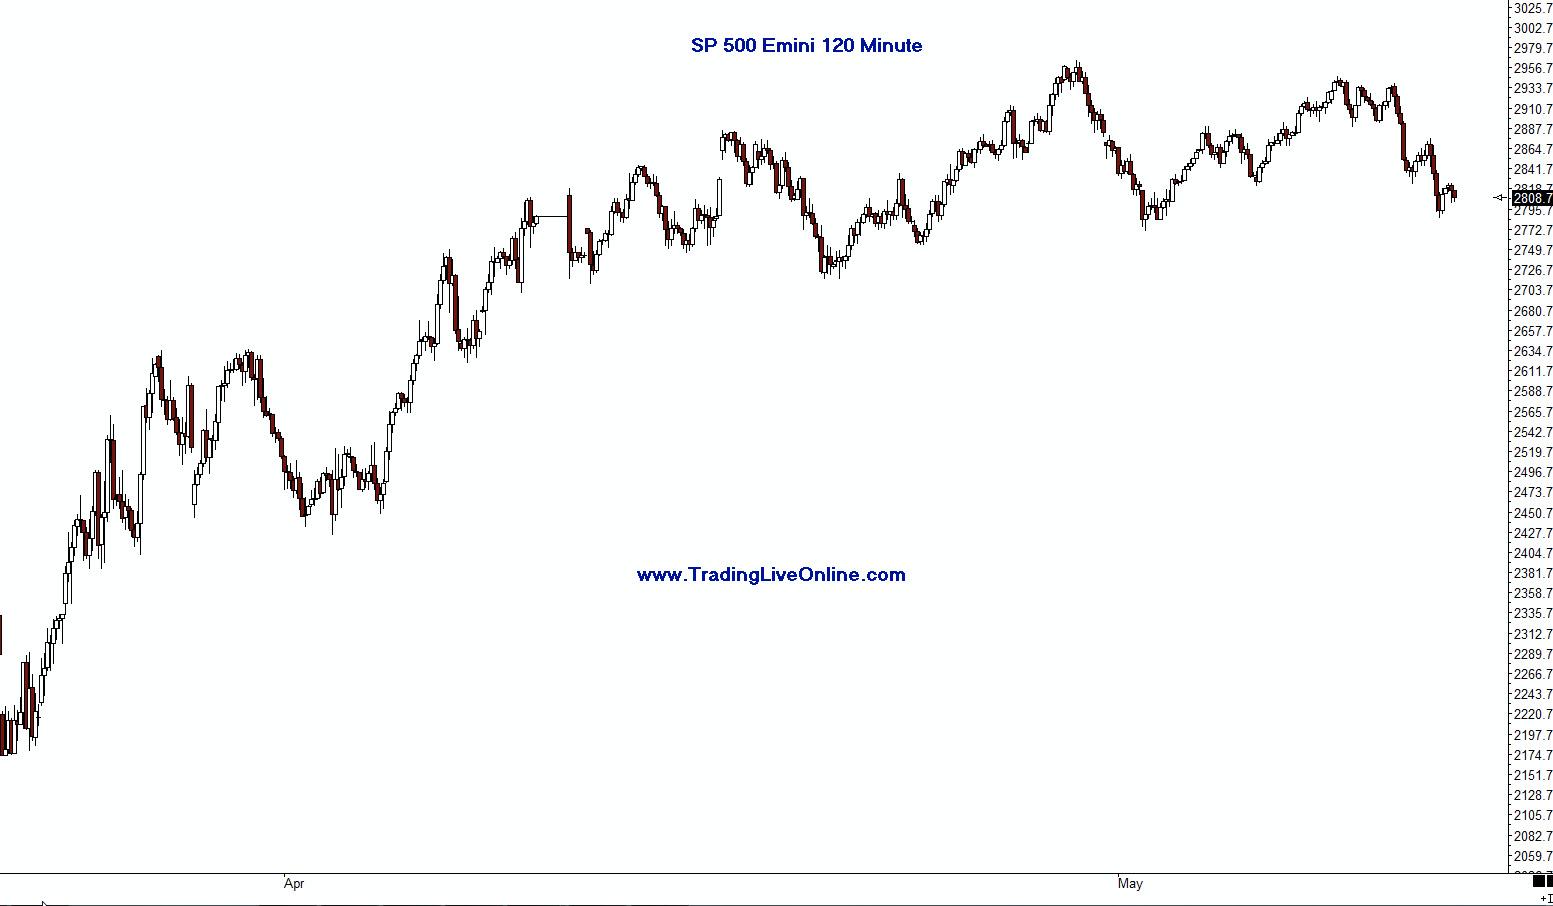 Chart 1 - Harmonic Price Swings S&P 500 Emini 120 Minute
A chart with swings such as these can be difficult for traders to make sense of. One day a move up, the next down, the market looks like it may turn down and back up the next. Let's see if we can add some order and find repetitive qualities in these swings that can help traders;
- Identify tradable setups
- Identify stop loss locations
- Identify entry points
- Identify profit target exits
- Identify contraction and expansion phases
Chart 2 below has the upswings marked in various colors corresponding with a repetitive swing.
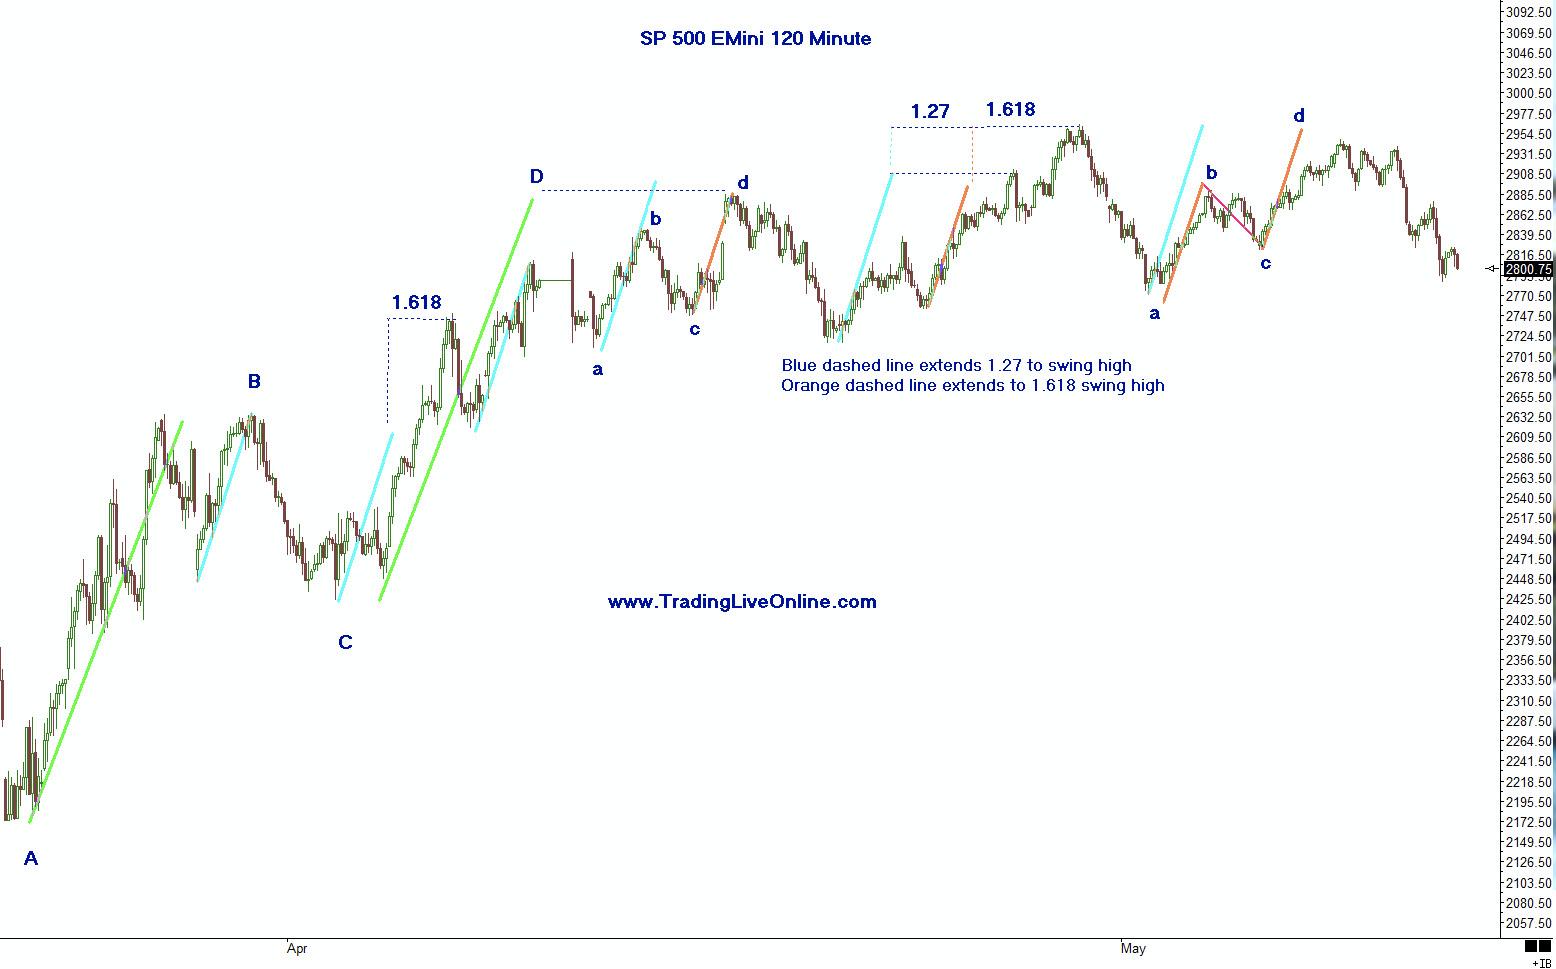 Chart 2 - Example of repetitive swings, contraction, expansion and tradable patterns
Market prices only do 3 things;
- Move up
- Move down
- Move sideways
This is what they have always done and will always do. (See Chart 3 below)
Markets are constantly going through phases of contraction and expansion. Contraction phases will form ranges with swings, testing prices within the range. Eventually, price within the range will move outside, either continuing a trend or reversing direction.
Let's look at Chart 2 and start with the green longer swings. This swing up started towards the end of March 2020 following a severe decline. This swing was the largest upswing since the decline began in February 2020. You can see it repeated after a pullback into early April. This would be a larger harmonic, and it can certainly alert market participants to a change in character.
The other swings I have marked on this chart are in blue and orange. These swings had many more repetitions in this section of price than the larger green lines.
Generally, there will be contractions and expansions of repetitive harmonic swings. The blue and orange swings are examples of the contractions. These will usually correspond to a Fibonacci ratio, such as .618% of a larger swing.
Notice the Fibonacci extensions marked 1.27 and 1.618 toward the top of Chart 2. These are illustrating expansions of the blue and orange repetitive swings and forming a confluence area that is now a resistance area.
Notice also the fascinating confluence of the green, blue and orange swings that all ended in the same price area. You will see "D" and "d" marked at that swing high. Many of these swings relate in a manner that help find ends of swings, beginning of swings and trading setups.
Although there are several types of patterns formed with these types of swings, one of the primary setups formed is the AB=CD pattern. If you look to the far right of the chart, you will see a current AB=CD sell pattern with equal length AB and CD swings. In between these swings is a retracement swing labeled BC.
It's worth mentioning that there can be variations of the CD leg, and study of this is worth traders' time and attention. It's unfortunately too lengthy a subject for this particular article.
Chart 3 below has very similar swings to what is described in this article, with the same principles. This is a strong argument for "nothing is new in price behavior"; up, down, sideways, expansion, contraction. (See Chart 4 below for comparison of Harmonic price swings).
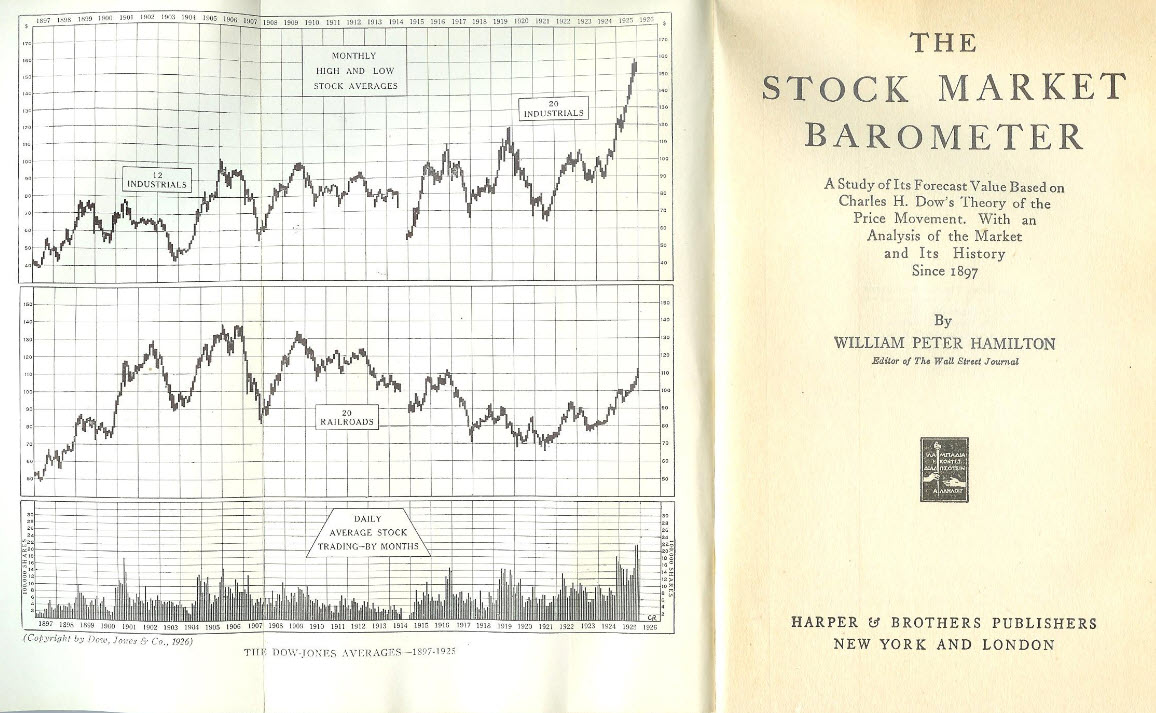 Chart 3 - Monthly Chart of The Dow Jones Averages 1897-1925 from 'The Stock Market Barometer', by William Peter Hamilton, copyright 1922
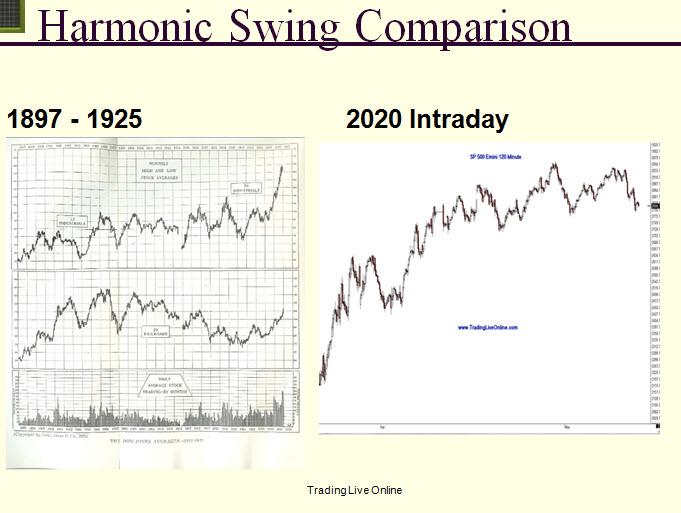 Chart 4 - Comparison of Harmonic Price Swings
Note: None of the markets, ETFs or stocks listed in this article are recommendations to buy or sell; this article is intended for educational purposes only.
It's always important to learn entry skills, which include combining elements of intraday time frames, momentum indicators and other price patterns to control risk and also, at times, waiting on the sideline until there is confirmation.
There are trading techniques that can be learned and implemented to control risk and monitor the price behavior. We never know what price will do and the only element we can control is the risk.
If you would like to learn more about these patterns and programs in order to learn how to trade them, please visit me at my website www.tradingliveonline.com or feel free to email me at ljouflas@msn.com.
Best wishes for successful trading!
Leslie Jouflas, CMT